

.png)

.png)
Introduction
The increasing adoption of NFTs has attracted a significant number of developers, artists, investors, and enthusiasts into the space. The idea of owning a digital asset has sparked a lot of excitement but has also generated a lot of skepticism. Some believe NFTs have solved the problem of digital property rights once and for all, while others are certain that it’s all just a big scam. Those that are interested in picking up their first NFT find it difficult to sieve through the noise to find quality projects. Rug pulls and scams are getting increasingly common in the NFT space. Even if a project isn’t a scam, there’s still a ton of execution risk and uncertainty about its longevity. So what are some ways to evaluate a NFT project? What are the important metrics to look at?
Here are key things to consider before ape-ing in:
Team behind the project
Like all art pieces, the people behind the NFTs play a significant role in affecting the future value of these pieces. A Beeple NFT is unquestionably more valuable than an NFT from your average Joe. As a result, it's important to think about the NFT creator's background, popularity, and reputation. To do this, NFT flippers often check the number and type of following on social media platforms like Twitter, Discord and Instagram.
Utility
Scores of "useless" NFTs have been sold for eye watering amounts this year. People shelled out seven figures for NFT rocks that had no utility beyond being able to be bought and sold. In light of this insane phenomenon, many argue that utility-focused NFTs are the future.
The utility of an NFT is what distinguishes it from other purely speculative NFTs. From owning and trading in-game assets, exclusive club memberships, to owning real-world tangible assets. These are just some of the benefits that NFTs bring to investors. Hence it is these characteristics that give an added value to these NFTs.
Rarity
This is the most fundamental metric that most people utilize. Basically, the rarer an NFT, the more valuable it is. There are typically characteristics or traits associated with NFTs that can be used to determine how rare they are.

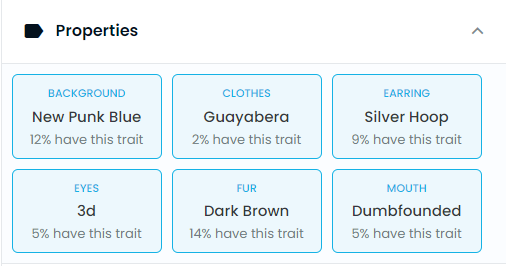
Take for example this BAYC NFT on Opensea. Under the properties tab, investors can identify the different traits of the NFT and assess its rarity in the entire BAYC collection.
Investors can also assess the rarity of their NFTs by using Nansen's NFT God Mode. Nansen provides rarity information that allows users to view details such as trait types, rarity rank, sales history and last traded prices for individual NFTs within a collection (e.g. BAYC below).
Trait Types and Rarity Rank Dashboard


The top 1000 Rarity Rank is a useful indicator to check the Top Sales from a collection. It also breaks down the rarity score percentage, # of total sales, # of traits, last price, and days since last sold.
Information is also available on the count of NFTs bearing a certain trait, as well as the trait occurrence vis-a-vis the entire collection.
NFT God Mode Trait Distribution Profile

However, not all NFTs belong in a collection. Sometimes a single NFT can be created by a famous artist / celebrity, making the NFT rare. E.g. The First 5000 Days by Beeple sold for US$69m back in May 2021. Rare 1 out of 1 NFTs are listed on platforms like SuperRare. As a result, investors looking for one-of-a-kind NFT pieces can shop there.
Diamond Hands Balance
Diamond Hands Balance refers to the total balance of NFTs belonging to addresses that have not sold any NFTs from a particular collection. In short, diamond hands balance refers to the number of holders who plan to hold an NFT with long-term foresight (opposite of paper hands which is the regular case for collections which is evidently used for short-term flipping).
NFT God Mode Diamond Hands for CryptoPunks

Seniority distribution
Nansen’s seniority distribution shows the distribution of NFT ownership overtime. As we can clearly see in the chart, the majority of CryptoPunks NFT owners hold their NFTs for between 90-365 days, which is a healthy sign that the collection is not a pump and dump scheme and is a good indicator of diamond-handedness and faith in the continued development of the project.
Another healthy sign of growth is a gentle upward slope of unique addresses over time. This is a useful indicator to identify projects that have long-term focused communities, and have a wide and growing community rather than being concentrated in the hands of a few whales who may dump their holdings and move on unexpectedly.
NFT God Mode Seniority Distribution for CryptoPunks

On the other hand, looking at the seniority distribution (below) for the Dopey Ducklings NFT collection, we can clearly see that the ownership turnover rate is much higher than CryptoPunks. This higher turnover may signal a lack of confidence in the collection’s potential and may be a potential red flag. However on the flip side, it may also indicate higher liquidity for this specific NFT collection.
NFT God Mode Seniority Distribution for Dopey Ducklings

Liquidity
Illiquidity is one of the greatest issues faced in the NFT market, and this poses a big risk for NFT investors. What's the point of owning an NFT if you're not going to be able to sell it later? We frequently notice sellers asking for exorbitant prices, while looking at the prices of several NFT collections. However, in actuality, how often are these NFTs sold for such ridiculous prices? As a result, it's possible that the pricing of many NFTs incorporate an illiquidity premium.
Therefore, NFT investors can analyze the liquidity of the different NFTs and their collections as part of their investment strategy. Using the Nansen NFT God Mode, we can do this analysis with ease. Lets use the BAYC NFT collection as an example.
NFT God Mode Dashboard for BAYC


With the Nansen NFT God Mode overview dashboard, we can track the number of transactions that occurred within a specific time period as well as identify if any smart money is investing in the particular NFT collection. With higher transaction volumes, this implies that there is a higher chance of investors being able to sell off their NFTs with greater ease in the future.
Want to know if Smart Money is still buying a particular NFT collection? The NFT God Mode overview dashboard is available for FREE to all Nansen Lite subscribers. Sign up today and start exploring!
Investors can also utilize the NFT section of the wallet profiler to assess liquidity metrics. For example, at the right most column, we see liquidity velocity and liquidity risk.
Wallet Profiler NFT Portfolio Profile

Liquidity risk is based on the amount of recent sales for that particular NFT collection. The greater the number of sales, the lower the liquidity risk. Whereas, liquidity velocity is based on how the liquidity risk is changing recently. Positive liquidity velocity infers that more transactions are happening, thus lowering risks. It is important to note that there is no correlation between both liquidity risk and liquidity velocity.
Smart money activity
Taking a look at recent transactions made by the top holders and smart money can offer insight into their current view of the collection. If top holders and smart money are actively adding more to their wallets or buying pieces that are above floor, it might signal that they’re optimistic on the future of the collection, vice versa. Under the trade section of NFT God Mode, users can view the latest purchases by the top 5 largest holders of the specific collection, smart money purchases and the last 1000 transactions in the past 30 days.
Nansen NFT God Mode Trades for CryptoPunks


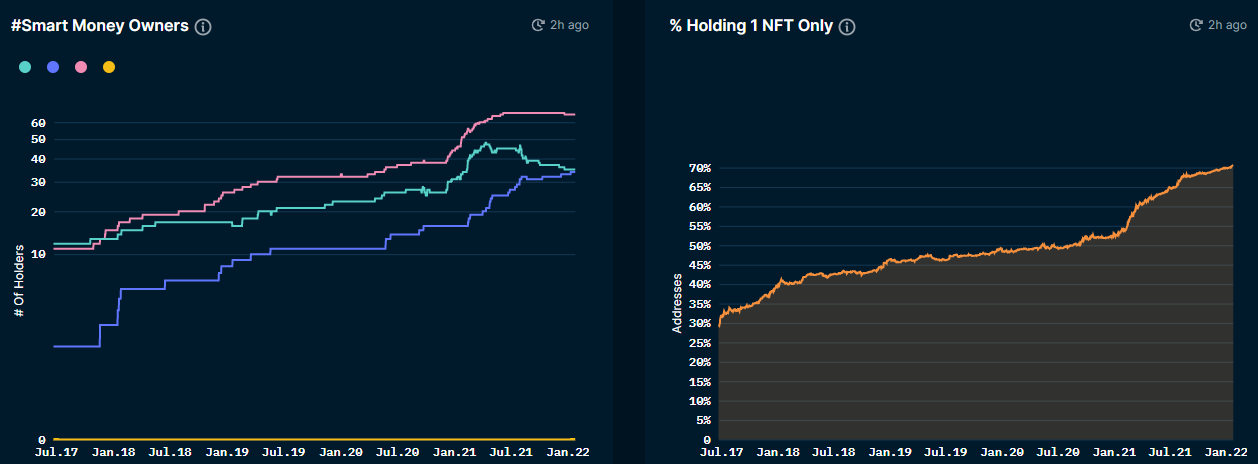
Nansen’s NFT God Mode also allows users to analyze the number of smart money owners for each NFT collection. Generally, if the number of smart money owners and % of addresses that hold 1 NFT increase, it is a bullish indicator. As the % of addresses holding 1 NFT only increases, this reduces the likelihood of a whale dumping their assets in the open market, creating a massive ripple effect that is commonly seen in the open crypto markets.
Looking at the chart below (holder breakdown), we see that there is a recent strong gradual increase in the number of smart money hodlers (blue line) and a slight recent decrease in the number of smart NFT traders (green line) for the CryptoPunks collection. This may indicate that the CryptoPunks NFTs are falling out of favor as a short-term trade.
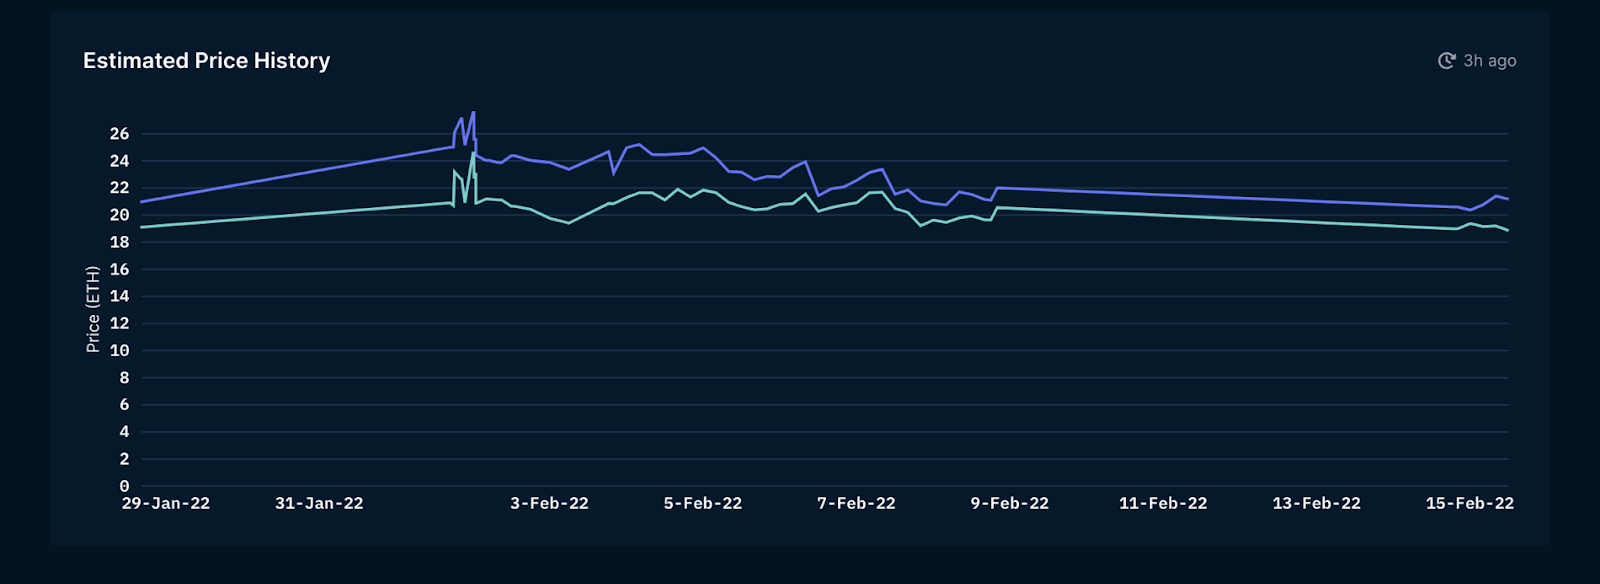
NFT Price Estimator
The Price Estimator looks at sales history and traits to estimate the most precise price available for any given NFT. It may be useful for identifying new opportunities and getting the best value possible, when buying and selling NFTs. Due to the depth of ML involved, we currently cover only three collections (BAYC, MAYC, and Doodles) but we will expand to other collections soon!

In addition to price estimation, users can now also see:
- Current price premium of any NFT (% value above the floor)
- Breakdown of the traits which most impact the price given
- History of ML price estimates
- Price distribution of estimates for all NFTs in the collection

Using Nansen to surface alpha
There’s a ton of noise in the NFT space. Thousands of projects launch daily and it’s becoming increasingly difficult to keep up with all that’s happening. Nansen helps to cut through the noise and surface the signal to help you discover NFT projects that are worth looking into.
Here’s some tips on how to do that:
Follow the smart money
Smart Money on NFTs is super important. This is because of the nature of NFT trades, where communities often follow a leader to make their decisions. For example, one prominent figure in the NFT world is Pranksy, who is able to significantly influence NFT markets once he purchases or apes into certain projects. There are 4 types of NFT Smart Money Labels on Nansen, with each having their own definition, matching their strengths.
NFT Smart Money
Nansen’s NFT Smart Money section allows investors to stay updated on the latest moves made by their smart counterparts. Smart money tracker displays the latest transactions made by NFT Smart money wallets.
NFT Paradise Smart Money Tracker

Investors can view in-depth analysis about the buying/selling/minting activities of smart money labeled wallets. Similarly, this useful data creates opportunities for investors to identify high potential investment opportunities among the rest.
NFT Paradise Smart Money Activities


While smart money activity is a key way to find interesting collections, it would be imprudent to utilize smart money data blindly. Nansen provides a clean and seamless way to track the performance of these smart money wallets across the past 3 months.
Profit and minting leaderboards
Profit leaderboard and minting leaderboard under the NFT paradise dashboard offer users a consolidated view of the top performing wallets in the NFT space. The profit leaderboard shows the most profitable NFT traders while the minting leaderboard shows wallets that have made the most profits from minting and selling NFTs within the last 60 days.
One way to keep tabs on these wallets is to tag these wallets into smart alerts to receive notifications when these profitable traders are minting or purchasing any NFTs. The profit leaderboard below is sorted by total profit, which shows the net of revenue minus spent in ETH. However, if you are looking towards active traders, or flipping NFTs, who are actively buying and selling many different NFT collections, you could filter by collections bought and sold.


Wallet Profiler
One of Nansen’s core features is the wallet profiler - this forms a great way to understand which collection big players have their eye on. The wallet profiler includes estimated portfolio value (ETH), recent NFT buys and sells in accordance with the date, realized gains and losses. This is a comprehensive tool to use when analyzing the portfolio and performance of a user's NFT wallet.
Wallet Profiler Dashboard for Pranksy’s wallet


Keeping up with the hottest trends
As NFT action is highly mercenary (unless we are talking about constant top performers and bluechips), getting to know what is ‘hot’ now is very important. Being able to get in early is crucial to maximizing upside and reducing downside.
NFT Market Overview
A simple dashboard that can be used for this is Nansen’s 24H NFT Market Overview under ‘NFT Paradise’ which summarizes what is currently happening in the market. From the picture above, we see that ‘SuperNormalbyZipcy' is leading the pack by a large margin in terms of volume. This highlights that there is huge demand and supply being traded right now, giving rise to possibly more liquidity in this illiquid NFT market. We could also sort by other characteristics such as 24H change in floor price or 3D change in floor price to ride on momentum for flipping purposes.

Mint Master
Nansen’s latest mints dashboard displays the latest NFT projects that are sorted based on FOMO (Fear of missing out) level. During peak NFT seasons, this is an incredibly useful tool to identify NFT minting opportunities that have attracted huge minting activities.
Read our guide on NFT analytics tools for investing >
Latest mints dashboard

The FOMO level is based on the amount of minters in the last 15 minutes. Note that this only includes projects minting in the last 14 days.
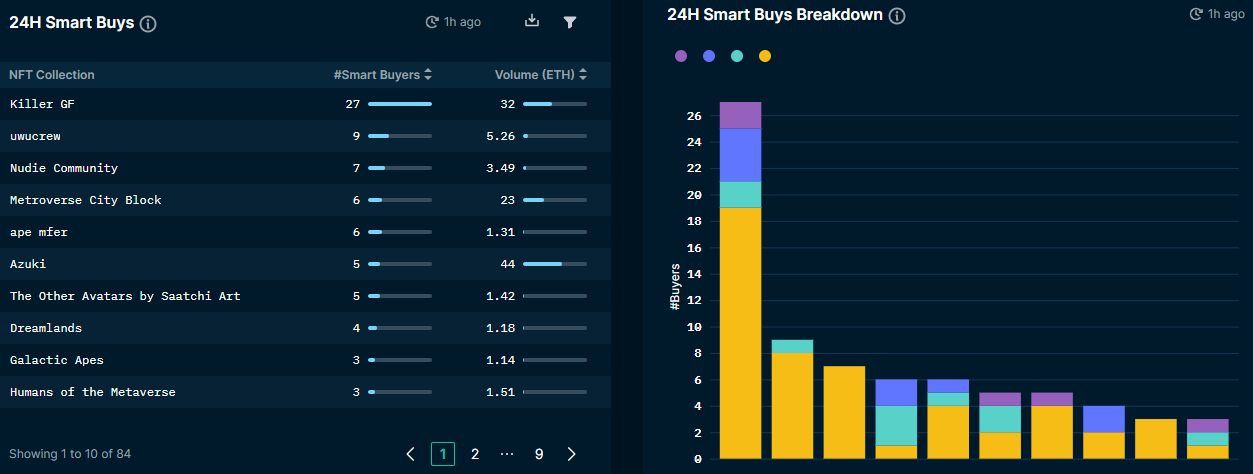
Minting Volume / Smart Minters 24H

The above dashboard lists the NFT collections with the highest minting volumes in the past 24 hours, as well as NFT collections that have been minted by smart money. As discussed earlier about the importance of identifying where the smart money is flowing, this dashboard presents a way for investors to identify juicy NFT investment opportunities.
*Dashboard only applicable for projects that have started minting in the past 24hrs.
Nansen BlueChip index
The Nansen BlueChip index contains 20 of the largest NFT projects selected per quarter by liquidity and market capitalization. Examples of these projects included in the index are CryptoPunks, Cyberkongz, Meebits, BAYC and many others.
NFT Paradise Bluechip Index


Using the above dashboard, users can analyze how this index has changed over time from a volume and market capitalization perspective, including the last 3 months and intra-day stats. Since the start of the year, the chart has shown a huge increase in NFT activity on Ethereum. Similarly, users will also be able to identify the largest gainers and losers for the last 24hrs, compared to the previous 24hrs.
7 Day Bluechip Market Overview

Investors can observe critical changes in the index’s portfolio such as market capitalization, average traded price, number of wallets holding the NFT collection and % of unique ownership.
Conclusion
Overall, the NFT market is not a straightforward one. There are many factors affecting the value of an NFT as discussed above and many new forms of utilities attached to them are being introduced. NFTs are also a good way to diversify holdings in crypto. This can be especially so in a downtrend as many describe it as a “store-of-wealth”. But it is always important to take in mind the liquidity issues in the space and the risks associated with NFTs (such as rugs, value going to zero etc).
To keep up with such a dynamic market, one must always keep up on the latest developments and information of various projects through twitter & discord. Nansen helps you to keep up to date with what’s actually happening behind the scenes by giving you the transactional data.