


Introduction
Despite a brutal bear market, DeFi’s resilience has been incredible to watch throughout 2022. Paradoxically, the year birthed a DeFi renaissance while simultaneously witnessing cataclysmic price action. DeFi yields remain suppressed across the board and chasing yield caused plenty of harm this year. Nonetheless, the fundamentals remain strong, and with the washout of some of the largest centralized players, crypto returns to code instead of kings.
From a long-term value and ethos perspective, 2022 – particularly the end of 2022 – was been phenomenal, flushing out bad actors and returning users to permissionless structures. From a price-oriented perspective, 2022 was brutal. This article examines DeFi throughout 2022 through the lens of on-chain data, providing a broad overview of the space and how it has changed.
The multi-billion dollar fraud of FTX saw millions of investors burnt, and self-custody rose once more from the ashes. A mass exodus of funds from centralized exchanges to non-custodial wallets took place, and some of these funds went to cold wallets, but a significant portion of them found their way into DeFi.
For investors who want to understand DeFi better before leaping into the statistics, Nansen provides a complete overview: What is DeFi? This article deals with DeFi statistics, but Nansen also gives a similar summary for NFT aficionados: NFT Statistics 2022.
Key Statistics
DeFi’s TVL (Total Value Locked) stands at nearly $42 billion, at time of writing according to DefiLlama. This is a sharp drop from the year’s outset, where it stood at $166.7 billion, highlighting the primary story: DeFi lost 76% of TVL in dollar terms in 2022.
Ethereum remains the king of DeFi. The Ethereum ecosystem holds more than 58% of all the liquidity within DeFi in its ecosystem.
The largest DeFi exploit of 2022 was the Ronin bridge exploit. It occurred in March and saw losses of 173,600 ETH and 25.5 million in USDC, worth in excess of $625 million at the time.
Despite the pullback in TVL and the sheer size of the hacks, traditional finance analysts remain bullish on the sector. A report from Markets and Markets predicts that the global blockchain venture market will reach $67.4 billion by 2026, citing an increase in venture capital funding, greater adoption of blockchains for payments, and blockchain solutions in banking and cybersecurity.
MetaMask, DeFi’s most popular non-custodial wallet, boasts over 30 million users and 21 million monthly active users. According to EarthWeb, this represents an increase of 3,800% since 2020.
What’s more, 2022 has surprisingly been a year of institutional adoption. For the first time ever, an institution, JPMorgan, executed its first-ever cross-border transaction using DeFi on a public blockchain.
Ultimately, this overview puts into perspective the key statistics that the rest of the article will unpack in more detail: TVL plunging, Ethereum’s ongoing dominance, and retail and institutional uptake from a userbase perspective.
DeFi Protocol Statistics
The five most prominent decentralized protocols account for more than 50% of the total TVL in DeFi.
Lido
Lido, the liquid staking platform, is the largest protocol ranked via TVL and has more than $6.3 billion locked in its smart contracts. Investors have deposited more than 4.6 million into Lido’s ETH staking protocol, up from 1.6 million at the beginning of 2022. This total comes from 108,000 unique depositors, and roughly 30% of all ETH in the ETH 2.0 staking contract comes from Lido.

MakerDAO
MakerDAO, responsible for minting the decentralized stablecoin DAI, is the second largest protocol ranked via TVL, with more than $6.1 billion locked in its smart contracts. MakerDAO’s revenue crashed 86% in Q3 2022 due to weak loan demands, but the protocol remains a DeFi heavyweight.
Aave
Aave, the permissionless lending protocol, is the third largest protocol ranked via TVL, with more than $3.8 billion locked in its smart contracts. Aave’s TVL peaked in October 2021, and since the start of 2022 has seen a 75% decline in TVL. Nonetheless, it remains the largest lending platform.

Curve Finance
Curve, the stablecoin-centric decentralized exchange, is the fourth largest protocol ranked via TVL, with more than $3.7 billion locked in its smart contracts. Curve announced plans to launch a stablecoin, crvUSD, and released the whitepaper in Q4 2022.
Uniswap
Uniswap, the OG Ethereum decentralized exchange, is the fifth largest protocol ranked via TVL, with more than $3.5 billion locked in its smart contracts. Uniswap continues to command the pole position for decentralized swaps.
Uniswap dominated trading volume throughout 2022. Most of the $854 billion traded on decentralized exchanges in 2022 traded on Uniswap. Uniswap also consistently featured on the ETH burn leaderboard, burning thousands of ETH in 2022 thanks to the EIP-1559. Of the 1.2 million unique traders who used decentralized exchanges throughout 2022, only 145,000 did not use Uniswap: only 12% of active decentralized traders did not use Uniswap in 2022.

Nansen’s DeFi Paradise shows the largest liquidity pools in DeFi. Stable pairings on Uniswap came in first with close to $250 million locked in the DAI-USDC pool. Most of the largest pools feature ETH and stable coin pairings, meaning deep liquidity and low slippage for traders using decentralized exchanges to swap between these assets. This move towards lower-risk assets was a defining trend of DeFi 2022.
Platforms offering perpetual futures have been one of DeFi’s key growth areas. Derivatives platforms exploded in 2022. Platforms like GMX, Rage Trade, dYdX, ApolloX, and Perpetual Protocol absorbed hundreds of millions of dollars in TVL. Despite the general downtrend in trading volume and protocol revenue, crypto investors still display a serious appetite for leveraged trading.

Honorable mention goes to Aztec Network, a privacy-focused Ethereum DeFi yield aggregator that utilizes zkSNARK proofs and has shown impressive growth. A significant driver was the de-facto ban of Tornado Cash for United States citizens, and for those with privacy concerns, Aztec provides a great alternative.
Ethereum Statistics

Nansen’s ETH 2 dashboard shows that cumulative ETH staked in the ETH 2.0 contract stands at 15.7 million, up from 8.8 million at the start of 2022. Despite having no hard date for withdrawals, investors continue to stake: nearly 13% of the total supply of ETH has been staked in the ETH 2.0 contract. This behavior shows an acceptance amongst the crypto community that Ethereum will endure as one of the space’s prime assets. Check out this intro piece from Nansen for a complete guide to staked Ether: How to Stake Ethereum: A Complete Guide (2022).
ETH decreased in dollar terms by 69% in 2022. It traded at $3,829.57 on January 2nd, 2022, and at $1,212.33 at the time of writing.
ETH became deflationary for the first time throughout November 2022. The supply change since the Merge stands at 1,300 ETH issued, whereas if Ethereum still used to Proof of Work (PoW) consensus mechanism, issuance would stand at more than 1 million ETH. Ethereum has massively cut its inflation rate and strengthened ETH’s core value for investors.

Nansen’s ETH Tracker Dashboard shows the centralized exchange exodus movement marvelously. Investors pulled hundreds of thousands of ETH off of exchanges throughout 2022 and took it into self-custody, particularly after the collapse of FTX.
DeFi Blockchain Statistics
Arbitrum was the one of the fastest-growing blockchain in 2022. With more than $1.1 billion locked in its ecosystem and a rapid increase in transactional volume, this layer-two scaling solution gained massive traction during the year.

Solana lost the most TVL throughout 2022: Solana’s ecosystem lost 96% of its TVL in dollar terms in 2022. It started the year with $6.68 billion in its ecosystem and, at the time of writing, has just $290 million. The collapse of Alameda Research/FTX played a significant role in the collapse of the ecosystem due to how closely tied Sam Bankman-Fried was to it.
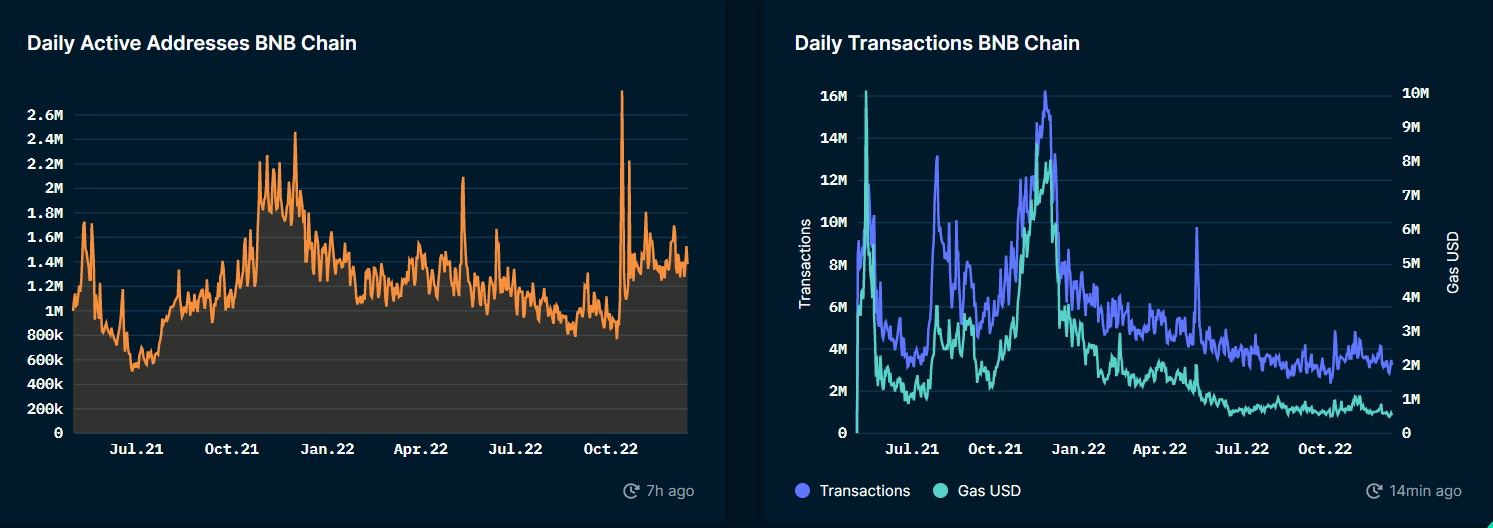
Among the most consistent performers for 2022 is the Binance Smart Chain. This blockchain has suffered a decline in its TVL from $12.2 billion to $4.44 billion but has shown superior relative strength and proven more resilient than its competition. PancakeSwap makes up more than 50% of the Binance Smart Chain’s total TVL. This food-themed DApp ranks as the eighth-largest decentralized application across all chains and the third-largest decentralized exchange within crypto. One of the few notable contenders to Uniswap and featured in Nansen’s Best Decentralized Exchanges list.
DeFi Growth Statistics
The TVL of DeFi has grown by more than 6,900% since 2020. It has increased by 264% since the start of 2021. But down 76% from the beginning of 2022.
Despite market fallout in 2022, the amount of capital locked in smart contracts across the DeFi ecosystem remains magnitudes larger than it was three years ago. In three short years, the total TVL of DeFi has grown nearly 70 times larger.
Decentralized exchanges executed $854 billion in trading volume in 2022, and this came from 5,687,713 unique trading addresses.
Layer two scaling solutions dominated 2022 DeFi growth, and in October this year, layer two scaling solutions officially began consistently processing more transactions than the main Ethereum network. As L2 volume ramped up, one major winner were cross-chain bridges, which have seen significant gains in volume – five different bridges have now topped $10 billion in total deposits. Solana routinely processed the most daily transactions of any alternative layer one in 2022. The Binance Smart Chain came in second, and Avalanche rallied in the second half of the year – likely due to the deployment of GMX – to come third. These alternative layer ones consistently process millions of transactions daily, showing that they still possess very active and very real investor bases.

Regarding the ranking of TVL across chains, data further feeds the narrative that 2022 belonged to layer two scaling solutions. Surprisingly, in 2022, the TVL of Tron flipped the Binance Smart Chain, which has long held the second position. However, the lack of DApps on the chain suggests large centralized players perhaps gaming the TVL system; the Binance Smart Chain remains the unofficial number two. Ethereum’s ecosystem is more than five times larger than its closest rival Tron.
Four of DeFi’s top ten ecosystems are Ethereum-centric: layer two scaling solutions, sidechains, or the main network itself.
DeFi’s growth shows no sign of slowing down, and Grand View Research expects that the decentralized finance market size will continue to expand at a Compound Annual Growth Rate (CAGR) of 42.5% from 2022 to 2030.
Unique DeFi users have risen by 40% in 2022. Despite market conditions, DeFi users have gone from 4.7 million at the start of 2022 to more than 6.5 million. The number of unique DeFi users has increased by nearly 700% over a two-year period, with just 940,000 users at the start of 2021.

Cumulative DeFi revenue grew from $3.7 billion at the beginning of 2022 to $5.22 billion at the end of the year, according to data provided by The Block, meaning DeFi generated north of $1.5 billion in 2022. These figures are up from $239 million at the start of 2021: cumulative DeFi revenue has increased by more than 2,100% since 2021.
DeFi Strategy Statistics
Yields have declined across the board in 2022.

Liquidity mining which was in vogue, and printing money in 2021, has fallen out of favor in 2022. Investors still supplying liquidity have learned about impermanent loss the hard way. Providing liquidity to high-risk pairings has decreased enormously in 2022. For investors who want to swim against the current first refer to Nansen’s Best Yield Farming Strategies and Guide to Liquidity Mining.
Supply APYs on lending protocols have become less attractive due to lower utilization rates. Data from shows that supply rates for USDC on Aave have declined by 65% in 2022. Supply APY started the year at 3.2% and finished at 1.14%: fewer investors possess the willingness to borrow and take risks in the prevailing market conditions.
The central growth area for DeFi earning strategies has focused on two key areas: supplying liquidity to derivatives exchanges and staking. Both of these strategies typically involve single exposure and thus expose the investor to no risk of impermanent loss. Nansen provides a guide for earning in DeFi, further outlining staking and its advantages, which have shone in 2022: Passive Income Strategies.
Lido’s runaway success throughout 2022 shows the appetite for liquid staking averaging close to 5% APY over the year, Chainlink released staking in 2022, and ApeCoin also released its staking program in 2022.
Summary
- DeFi TVL dropped by 76% throughout 2022.
- DeFi is expected to expand with a CAGR (Compound Annual Growth Rate) of 42.5% from 2022 to 2030.
- DeFi’s TVL has increased by 6,900% since 2020.
- DeFi is expected to gross $231 billion in revenue in 2030.
- North America dominates DeFi accounting for 34.85% of total revenue, but the fastest rate of DeFi adoption is in Asia.
- Decentralized exchanges witnessed more than $850 billion in trading volume through 2022 from more than 5.6 million unique wallet addresses.
- Investors still have an appetite for leveraged trading, and the most significant growth in DeFi has come from protocols specializing in derivatives.
- Higher-risk liquidity mining has fallen out of favor, with investors preferring stable pairings or blue-chip assets with stables.
- DeFi passive income has concentrated on staking and single-sided exposure this year.


