


.png)
Key Takeaways
Fungible token cycle: Nansen analysed investor sentiment and macroeconomic indicators with the following take-aways:
- Investor sentiment moved to “panic” in May 2022, flagging the start of a long period of crypto price consolidation (see Figure 1)
- For crypto prices to exit the consolidation phase and bottom out, fundamental uncertainty must decrease
- The main scenario for this would be the US Fed getting more preoccupied with unemployment, over inflation
- Real growth is slowing sharply, meaning this scenario is getting closer
- Historical analyses point towards a higher probability of the Fed pausing monetary tightening by Q1 2023 (see Figure 6)
NFT cycle: NFT vs fungible token correlations being weaker than inter-fungible-token correlations, Nansen developed an investor sentiment indicator specific to the NFT market, based on two on-chain metrics:
- Trailing realised volatility of NFT prices: higher realised volatility -> higher forward weekly returns
- Volume of Blue Chip NFTs vs all NFTs sales: higher ratio -> lower forward weekly returns (see Figure 21 for backtest)
Abstract
Our recent analysis of the crypto assets market revealed four insights:
1) Investors’ sentiment moved to extreme panic in May which translated to an accelerated allocation to stable coins (especially USDC) and flight to other digital (and non-digital) “safe havens”. This led to a phase of price consolidation in fungible token prices, which has more to run, in our view.
2) The current macroeconomic cycle is transitioning from stagflation, e.g. slowing real growth and higher inflation, to sharply deteriorating real growth and high residual inflation. The more real growth weakens, the higher the probability of the US Fed holding off further tightening (“The Fed put”). When this probability reaches a sufficient threshold, it will likely be supportive of cryptocurrency markets.
3) According to the macro indicators reviewed in our working paper, we are close (estimate of Q4 2022 - Q1 2023) to but not quite at this supportive stage yet.
4) This supportive pause in monetary tightening is likely to be shorter than in past cycles as we believe that inflation is likely to re-accelerate post-recession, led by global geopolitical factors, the disintegration of global supply-chains, and a multi-year spending “boom by boomers” who are enjoying their retirement (wealthiest generation in terms of asset ownership).
Expanding our analysis to the Non Fungible Tokens (NFTs) market, our analysis demonstrates that the following metrics tend to lead NFT prices: 1) NFT’s trailing price volatility and 2) Ratio of sale volume of more established collections vs all sale volumes. Finally, we caution that, given a small data sample available (slightly less than a year of weekly data), there are limitations to the interpretation of the observed statistical relationships around NFTs. Incorporating more out-of-sample live data in future publications will help validate the robustness of our findings.
1. Macro Outlook for Crypto Assets
1.1 Update on stablecoin risk appetite indicator
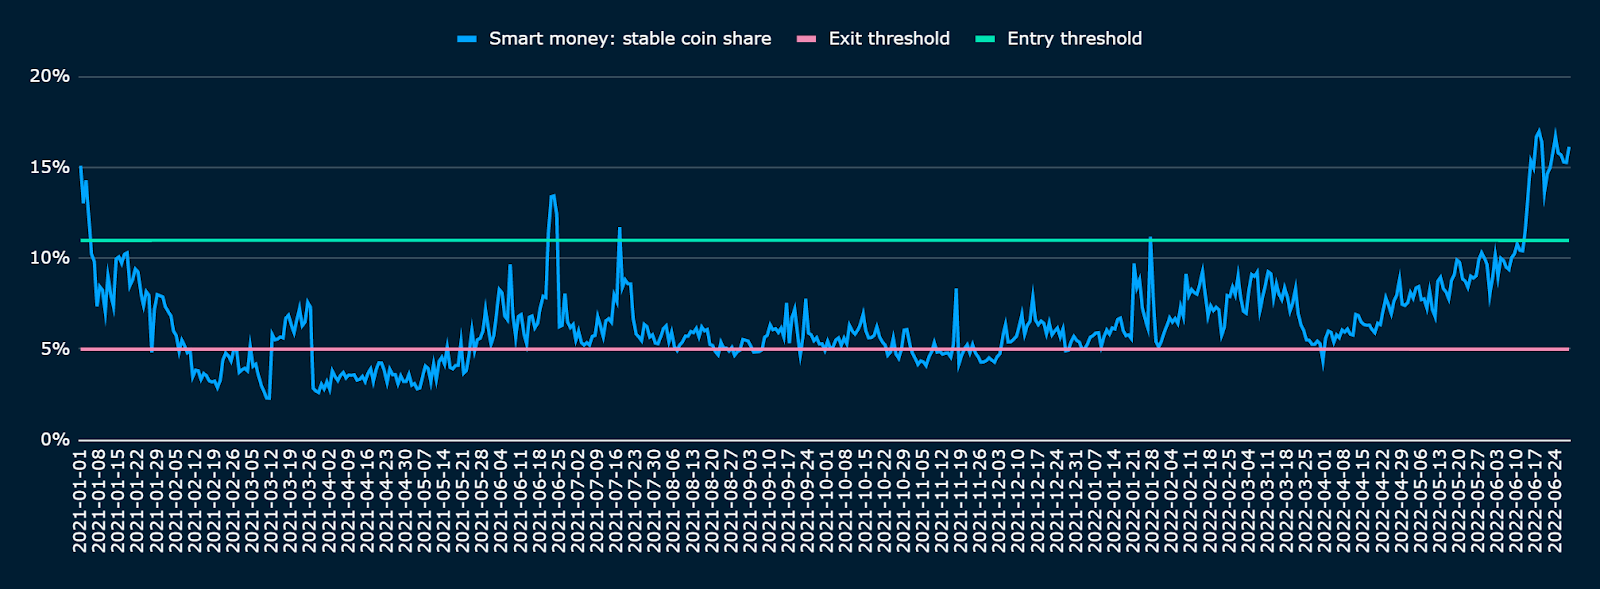
Nansen Stablecoin Risk Appetite Indicator gauges crypto investors’ sentiment by measuring the relative allocation to stable coins within the aggregated USD balance of Smart Money-labelled wallets (see Figure 1). In May 2022, this ratio surged and, at the time of writing this paper, it stood at ~16%, higher than our 11% “panic threshold” (see Using Nansen Smart Money and bridge data to simulate tactical investment). Following the events of UST and sETH respective de-pegs (see Nansen’s reports on the de-pegs here and here)and the unravelling of leveraged investment schemes across liquidity pools and other DeFi protocols, sentiment and price soured, understandably.
According to the Stablecoin Risk Appetite Indicator, investors are climbing a wall of worry, as crypto prices consolidate. A fall of the Indicator below the 11% threshold would trigger a risk-on signal, which would be synonymous with less bearish sentiment from Smart Money investors.
Figure 1: Stable coin risk appetite indicator
1.2 Transitioning to sharply deteriorating real growth and residually high inflation
Relying on sentiment alone is not sufficient to call for a contrarian “bottom” in crypto asset prices. Sentiment can remain depressed as long as the fundamental drivers behind asset prices remain negative. This is the difference between investors’ risk perception and the actual underlying fundamental uncertainty (more on this in section 3.1).
A macro environment of high and volatile inflation is historically bearish for risk assets (and crypto assets are no exception) as it forces higher discount rates even as real demand deteriorates (lower top line).
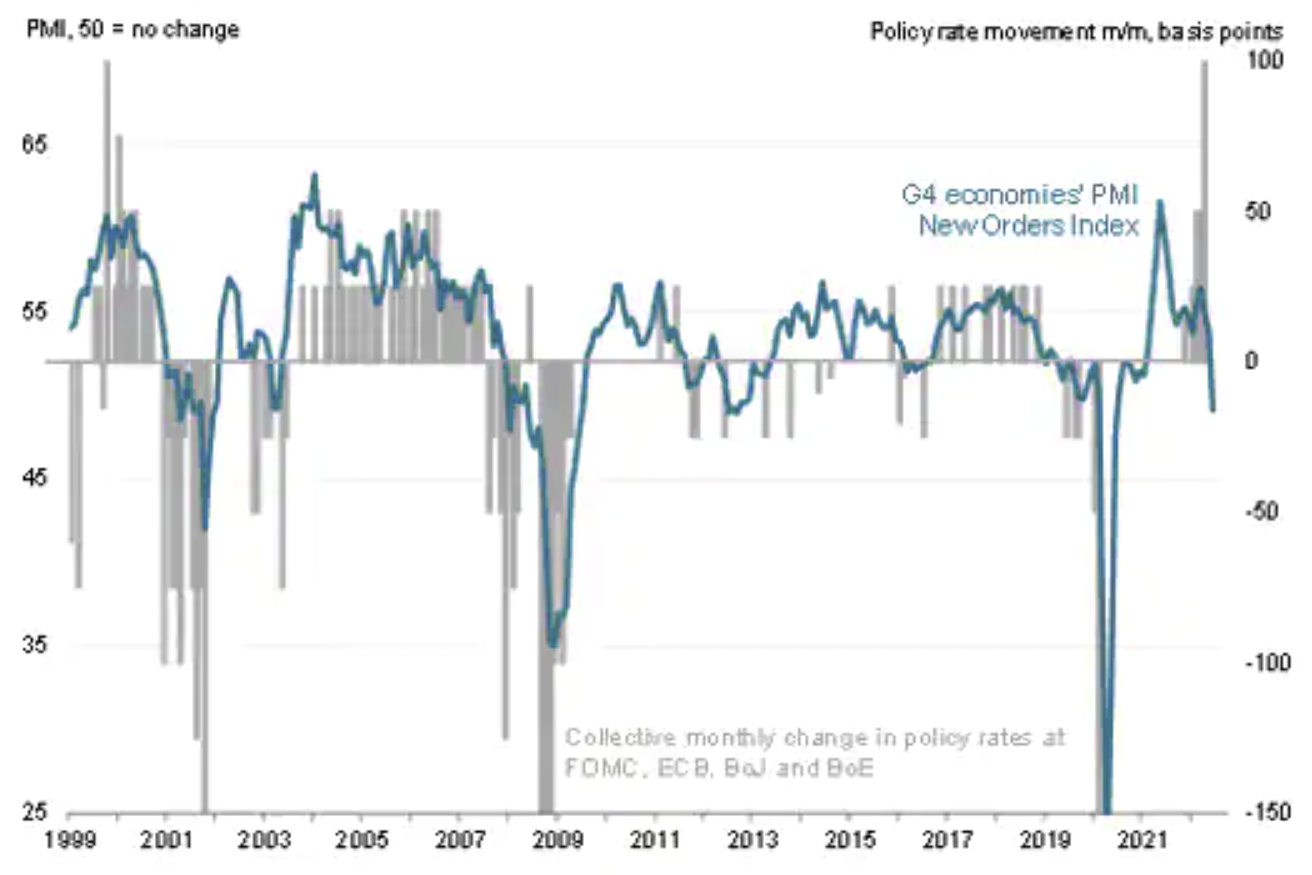
In the last few weeks, the macro momentum has been evolving. Growth is more obviously slowing and the data momentum is negative (e.g. rising number of negative surprises vs market expectations). This is especially visible in falling business and consumer surveys globally. Purchasing Managers' Index (PMIs) surveys, indicators which lead industrial and ultimately macro cycles, are moving to contraction (see Figure 2). Meanwhile, companies around the world are reporting a) replenished inventories, b) falling new orders, c) stabilising price pressures (for some sectors only as of June). As consumers elect to downsize spending to cope with higher prices, and as manufacturing supply chains normalise, demand-driven inflation is likely to normalise. However, inflation is far from the US Fed’s 2% target and non-demand related drivers, such as geopolitics and a technical lag in the rental component of the US CPI basket mean that inflation, even as it slows, is unlikely to return to the Fed target.
Figure 2: G4 (US, Eurozone, Japan, UK) Flash manufacturing PMI new orders, June 2022
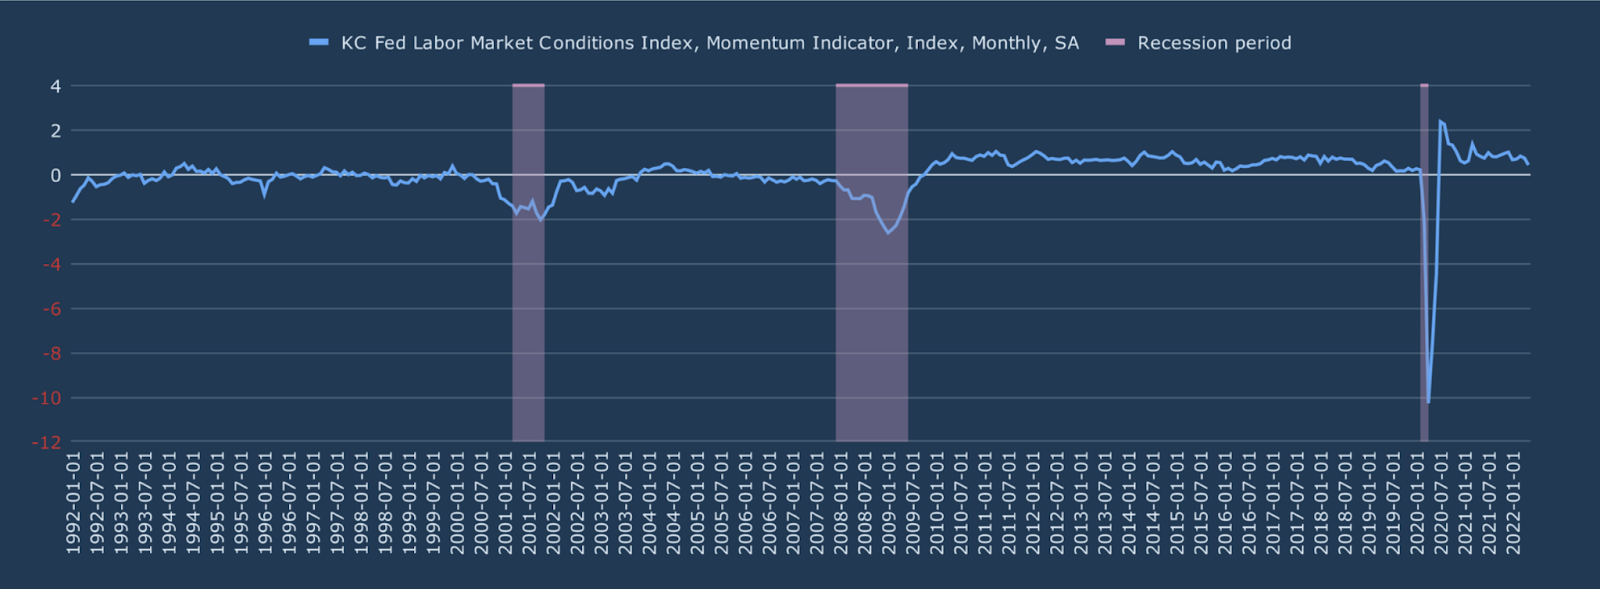
We then turn to the second component of the US Fed’s mandate aside from “stable prices”, that is “maximum employment”. The US labour market is very tight according to various metrics, but here too, momentum is negative. For example, the Kansas City Labour Market momentum indicator, which tends to contract before macro slowdowns is approaching 0 (see Figure 3).
Figure 3: Kansas City Fed Labour Market momentum indicator vs historical recessions
For now, the US Fed prioritises its inflation mandate, and the Fed Chair even implicitly acknowledged the high probability of an imminent economic recession in his recent Senate testimony: “[on soft landing] it is our goal, it is going to be very challenging… the question of whether we are able to accomplish that is going to depend to some extent on factors that we don’t control”.
1.3 Waiting for the ”Fed put”
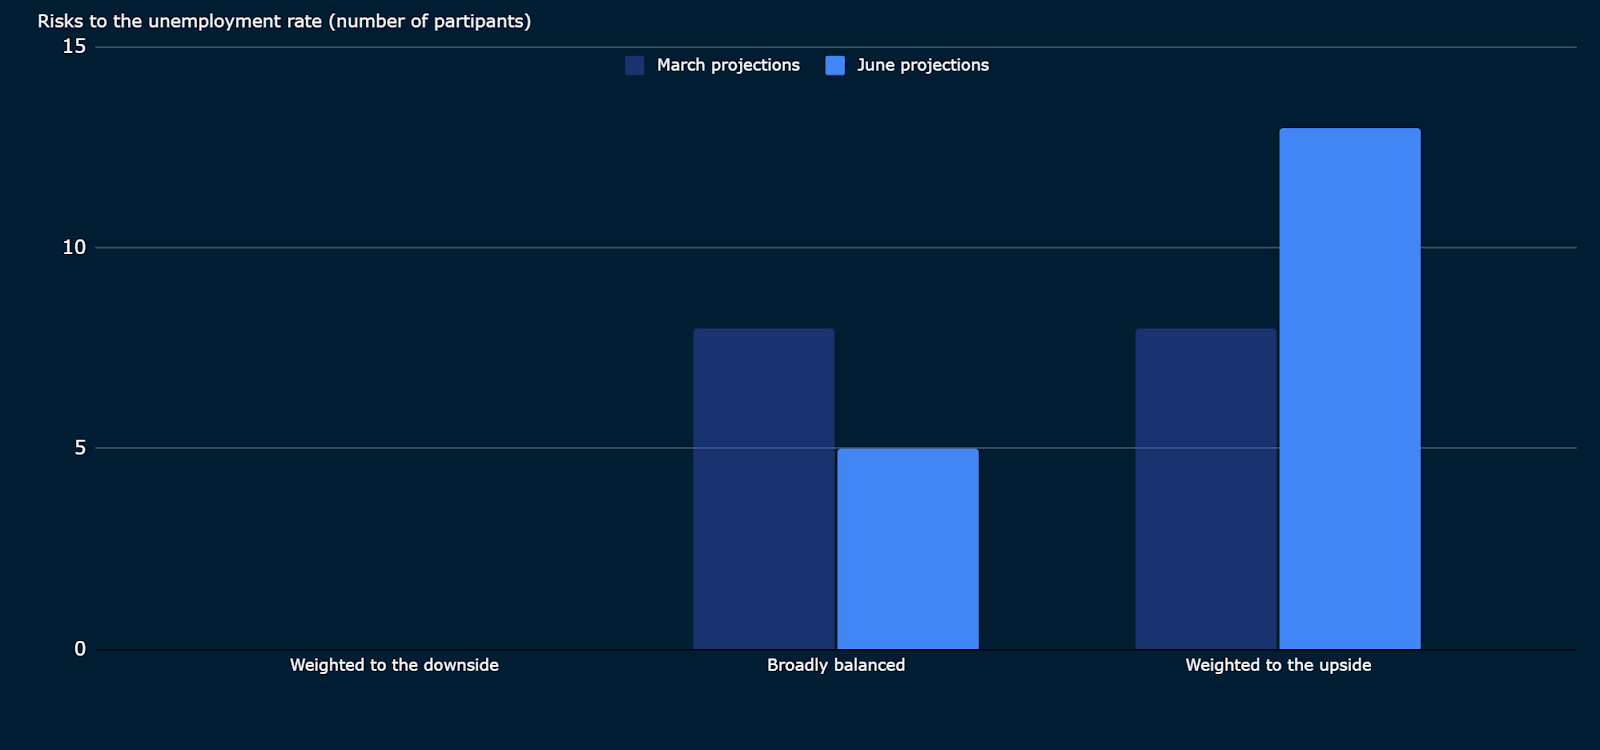
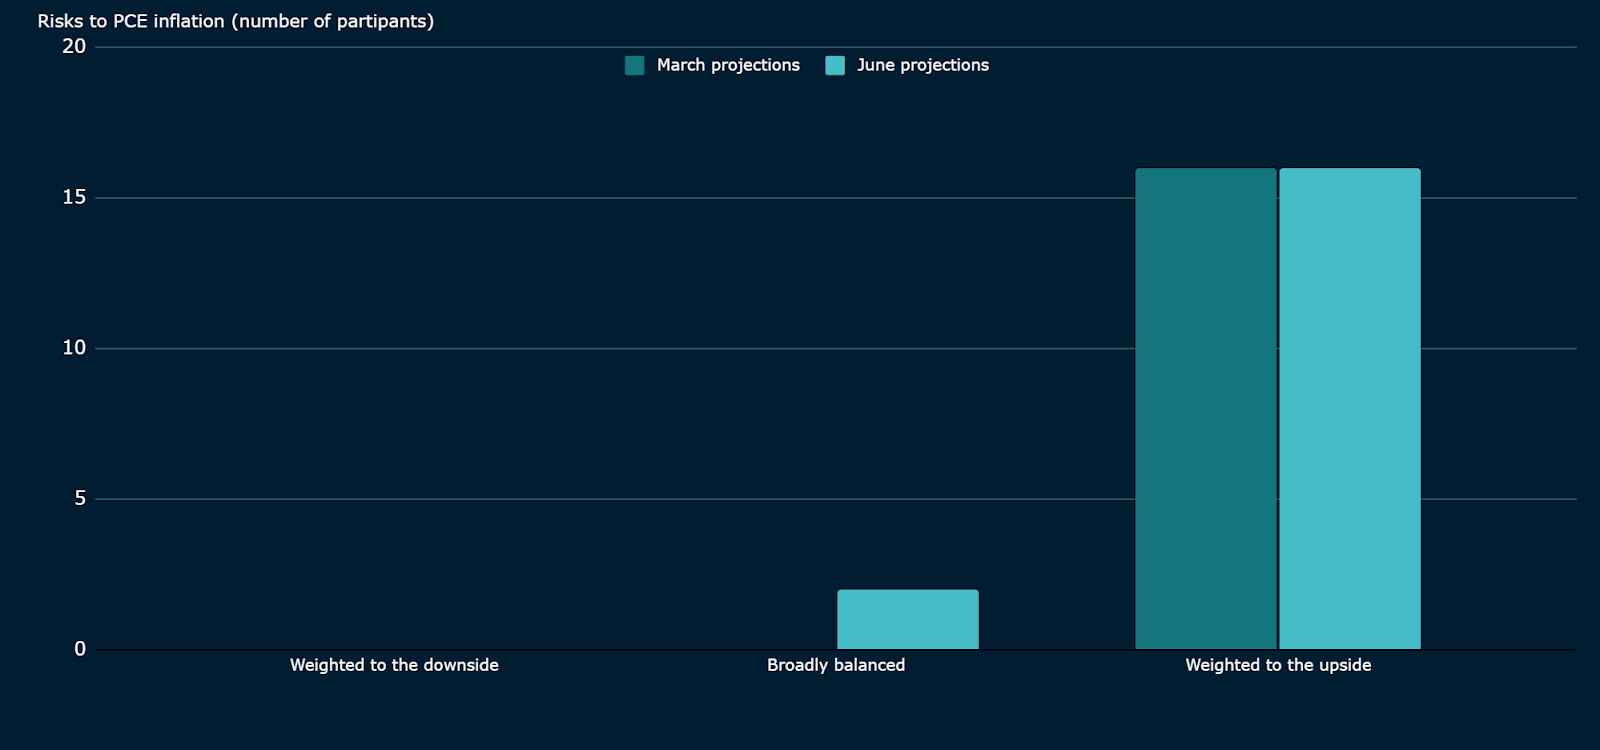
We expect the US labour market to deteriorate sharply in Q3 2022 - Q2 2023 and, from an area of uncertainty move to a primary source of concern for the US Fed (see Figure 4).
Figure 4: US Fed Summary of Economic Projections June 2022 meeting
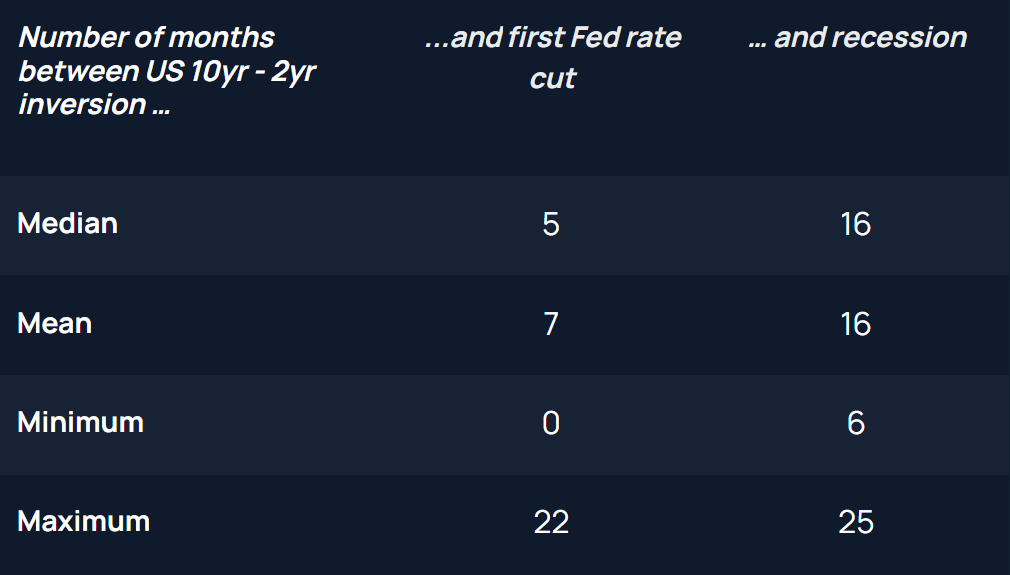
We attempt to measure a time range estimate for the Fed’s put to kick in, using the most reliable predictor of economic recessions, the US Treasury yield curve (see Figure 5). According to our historical analysis, the lead time between yield curve inversion (we use US 10yr - 2yr maturities here) and the first policy rate cut is ~7 months (average). This would translate into a higher probability of rate cut or, more likely , a pause in monetary tightening by Q1 2023, before a recession by Q3 2023 (16 months average lead). We note that the distribution of lead times is wide with the maximum or latest date for a Fed pause estimated in Q1 2024 (22 months). The most rate-sensitive risk assets, such as crypto assets, are likely to preempt the “Fed put”.
That said, we want to zoom in on the 1970s-early 1980s part of Figure 5, where the US experienced multiple alternating yield curve inversion and re-steepening episodes. This was coincidentally a period of high and volatile inflation. We suspect that 2023 and the following years will bear some similarities with the 1970s in the sense that the US Fed will have to focus alternatively on inflation and unemployment in a very short period of time.
Figure 5: US Treasury 10 yr-2 yr yield vs Fed fund reserve rates
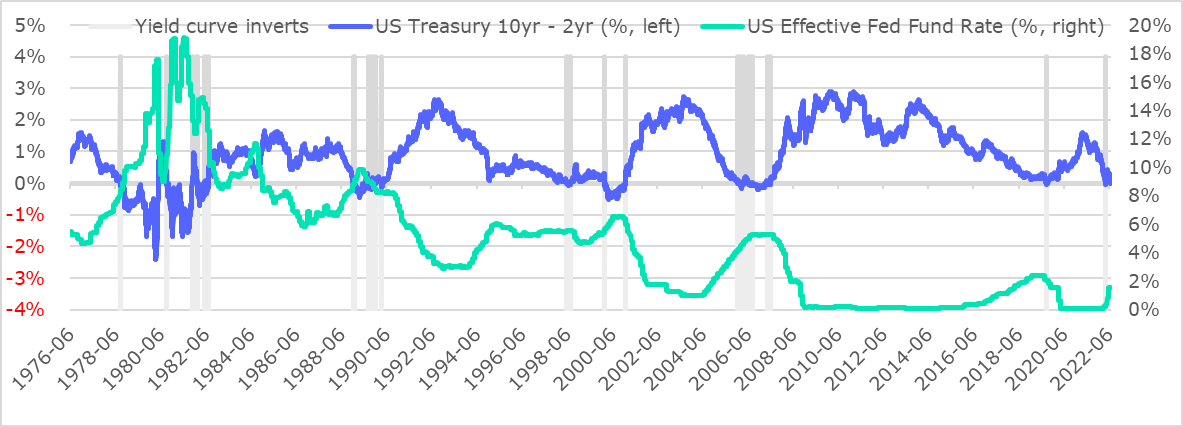
Figure 6: Historical distribution of time leads between yield curve inversion and first Fed policy rate cut /recession
1.4 Crypto cycle indicators
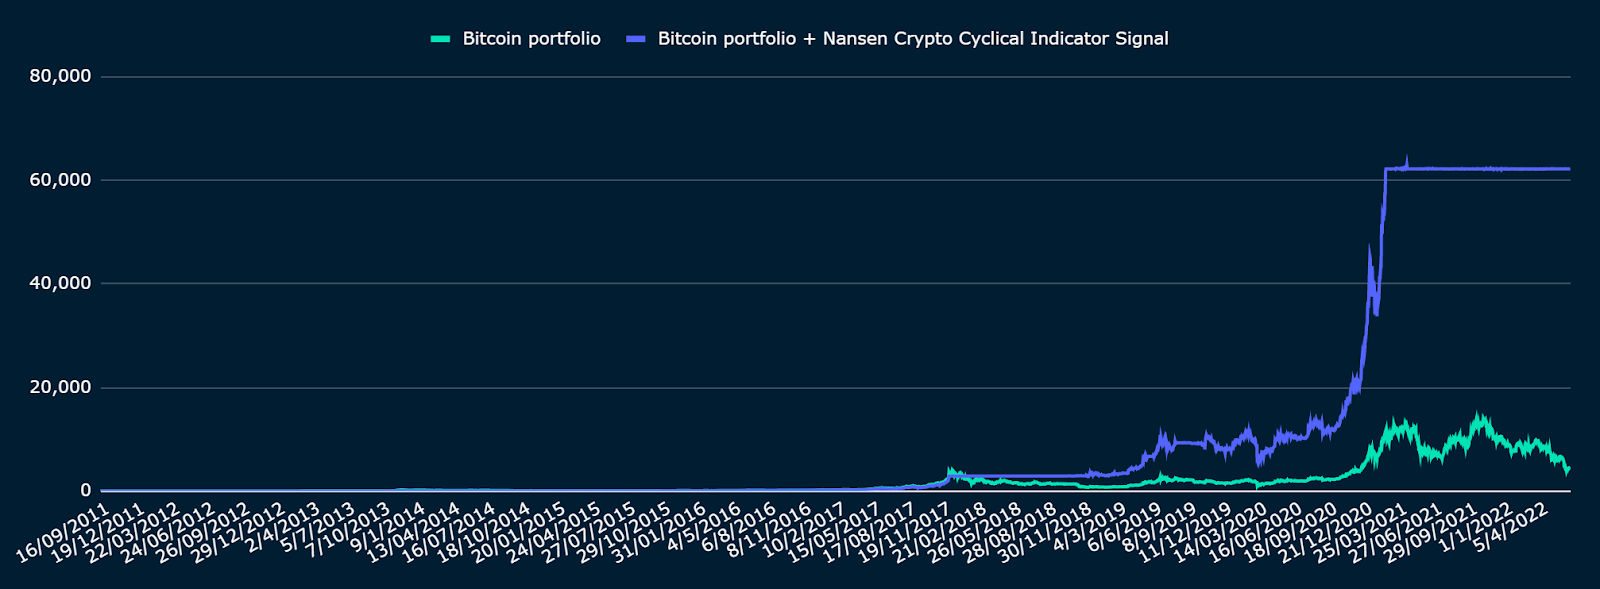
We summarise macro inputs, namely the steepness of the US sovereign yield curve, but also the rate of growth of G4 central banks’ balance sheets, together with an on-chain valuation of crypto realised cap vs market cap in the cyclical indicator presented in Figure 7. The indicator last turned risk-off in February 2021 and is yet to move to risk-on. We backtest the indicator (live since December 2021) and present the results in Figure 8. This Figure shows the return index of a strategy following risk-on (100% investment in BTC) and risk-off (100% investment in USDC) cyclical signals.
Figure 7: Nansen Crypto Cyclical Indicator (1=risk-on, 0=risk-off)
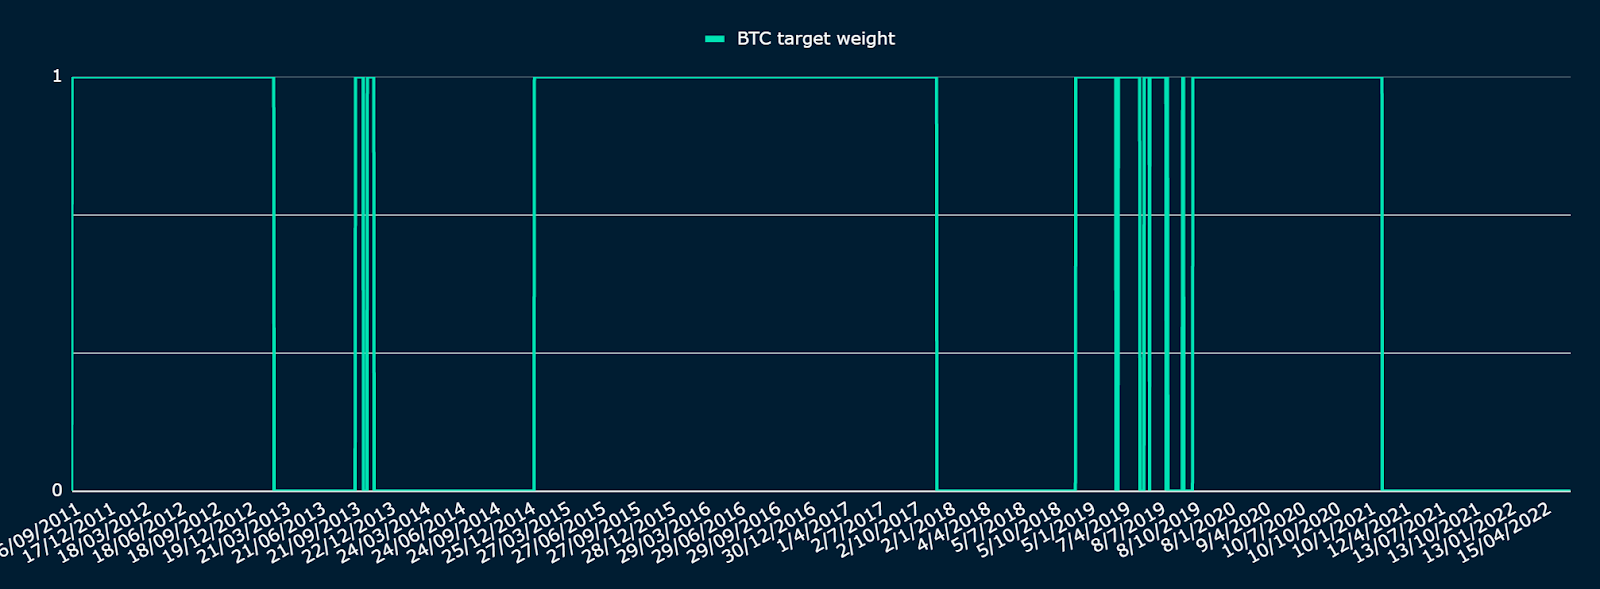
Figure 8: Backtest of Nansen Crypto Cyclical Indicator with a strategy of 100%/0% for BTC/USDC
1.5 The NFT market cycle
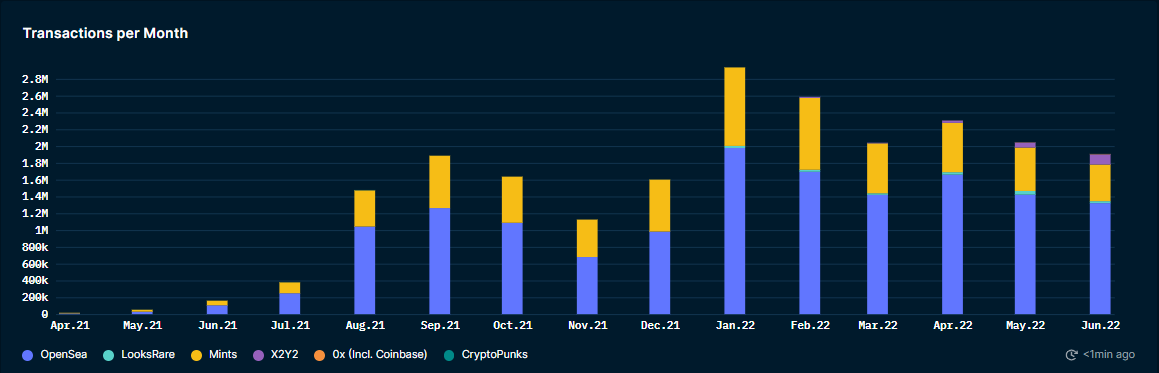
Turning to the NFT market, we have observed a similar risk off sentiment in the market. The monthly NFT transaction volume and transaction count have both declined since its January peak (see Figure 9 and 10).
Figure 9: NFT Monthly Transaction Volume on Ethereum (Monthly)
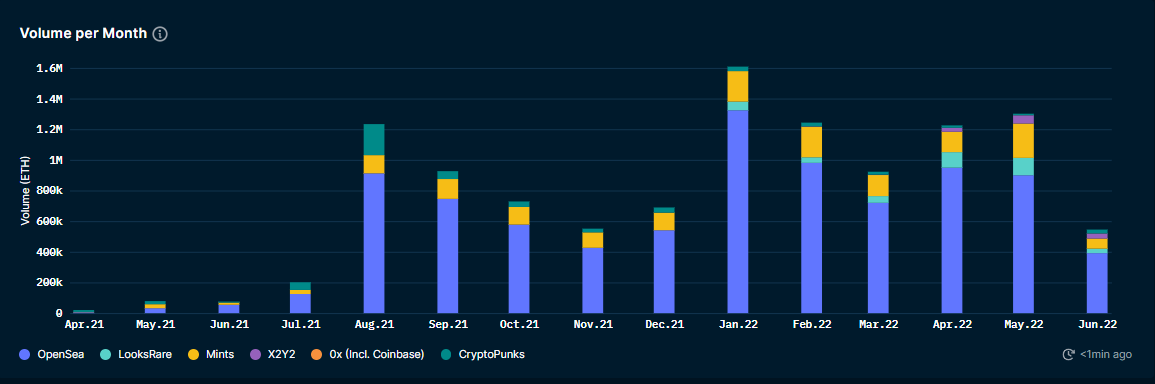
Figure 10: NFT Monthly Transaction Count on Ethereum
However, in the month of June, the Nansen NFT-500 index, alongside the Blue Chip-10, Social-100, Art-20 and Metaverse-20 indexes, all demonstrated a slight reversal in trend (See Figure 11). Notably, the Art-20 index experienced the greatest recovery of +32.6%; going from 739 points at the beginning of June and closing with 980 points at the end of the month.
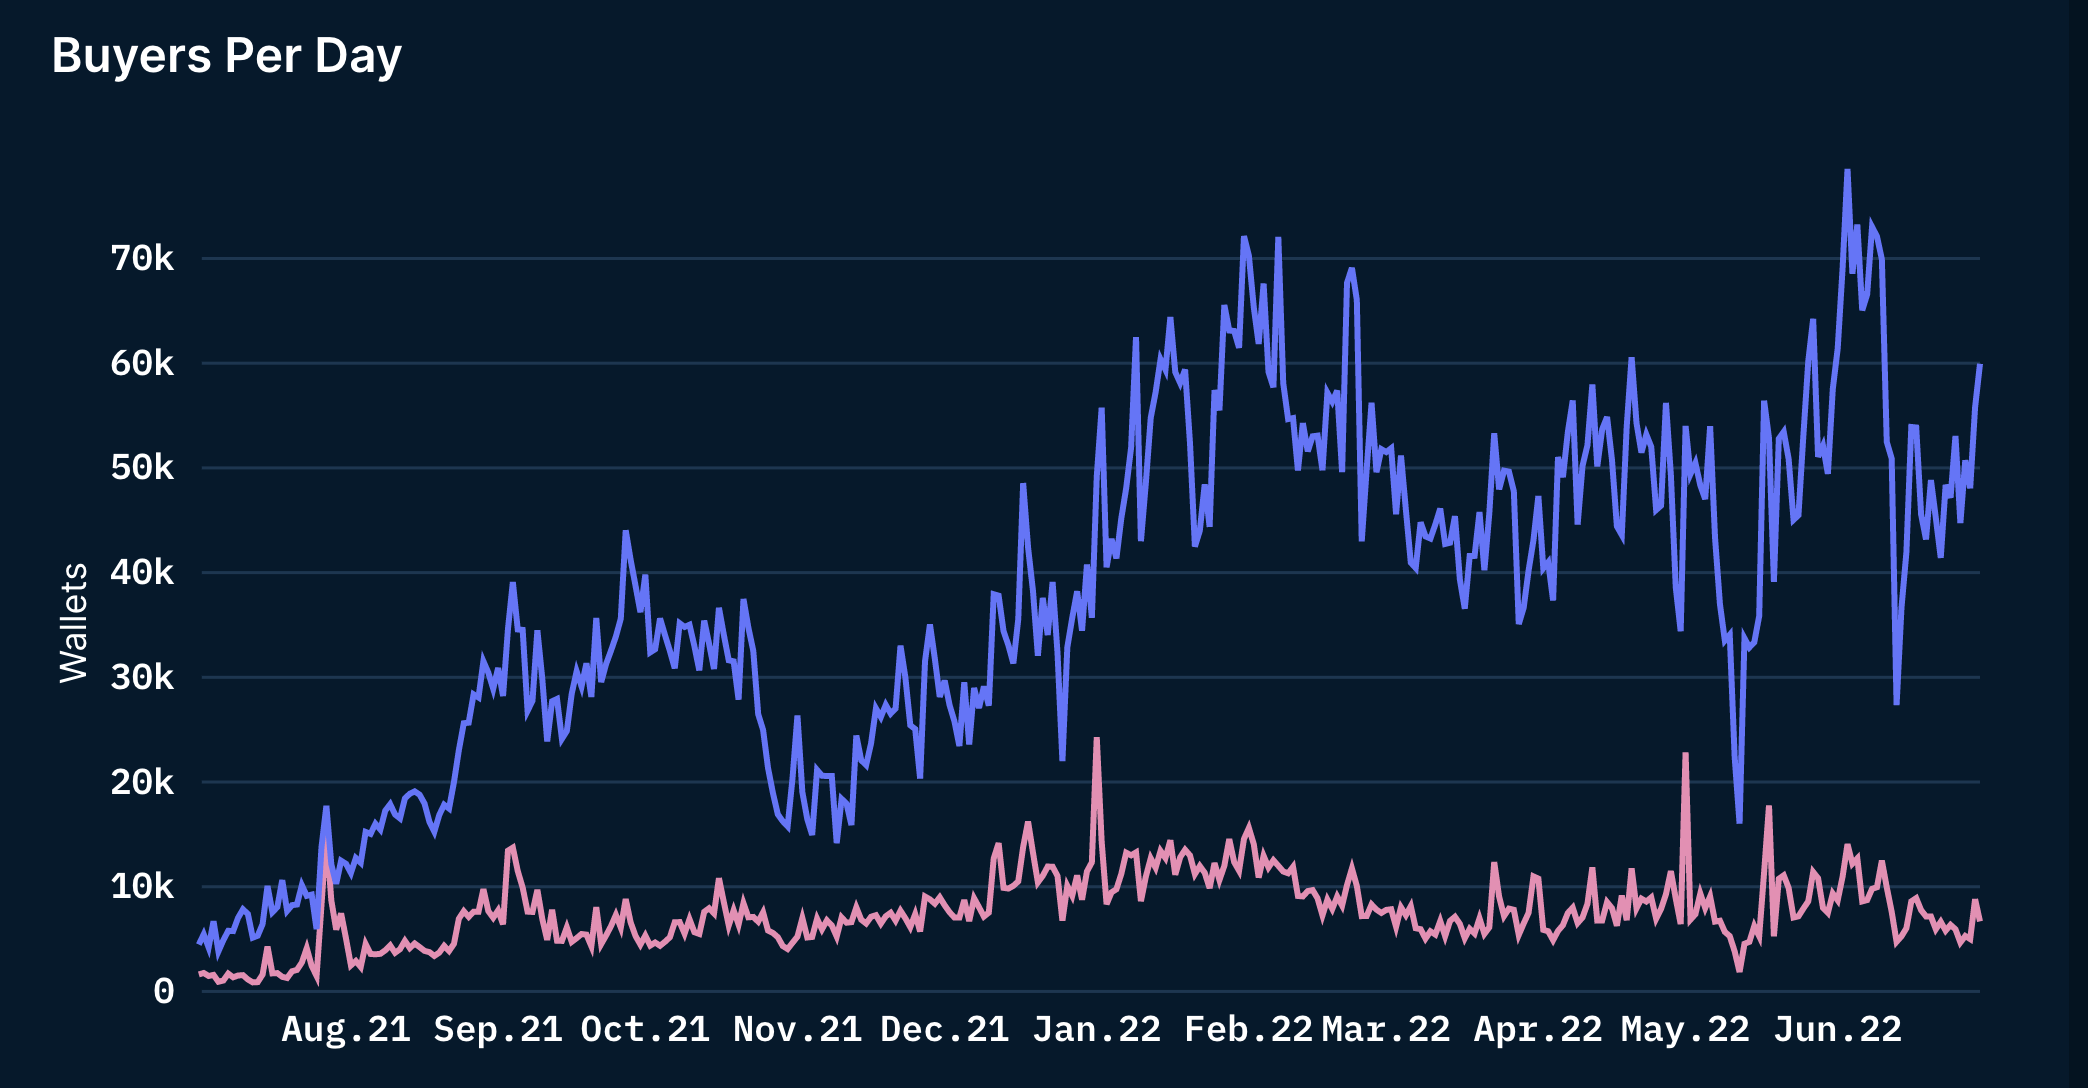
Close analysis of the NFT Buyers Trend reveals that in the month of June, we are seeing both first-time buyers and returning users slowly entering the market again (see Figure 12). Given previous correlation analysis hinted at lower correlation between NFTs and mainstream crypto assets than in between fungible assets, this finding prompted us to explore NFT-specific statistics and assess if and how they predate NFT price developments.
Figure 11: Nansen NFT Indexes
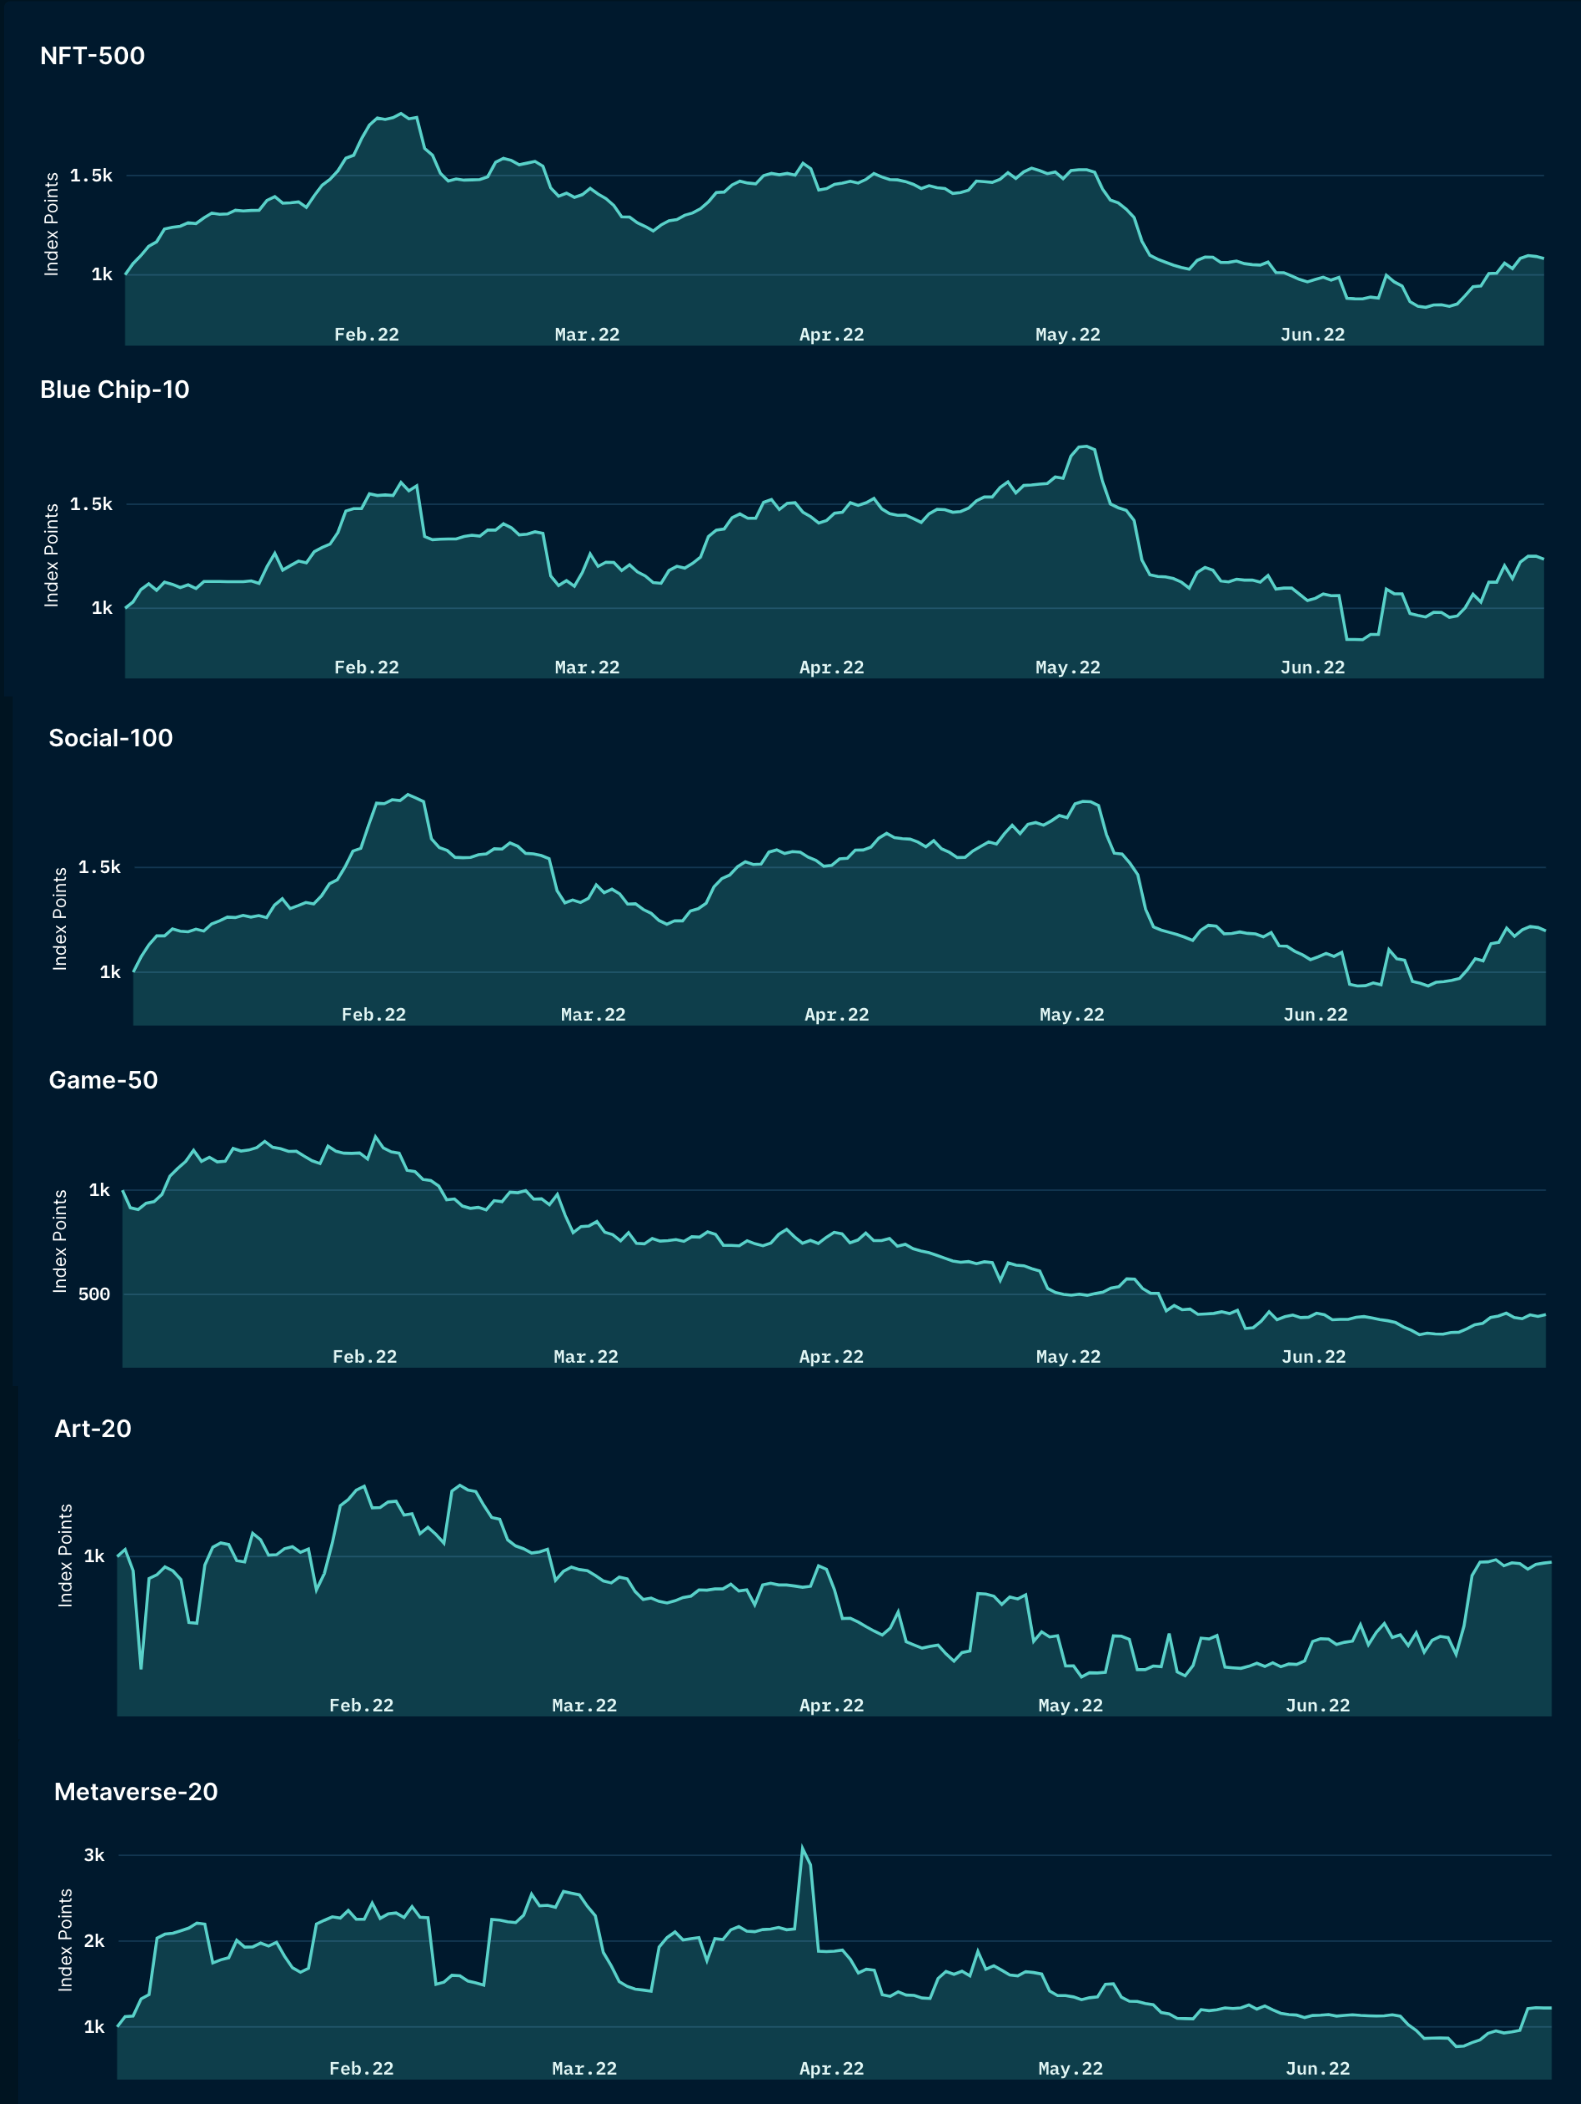
Figure 12: NFT Buyers Per Day on Ethereum
2. The gap in Investor Sentiment Indicator for the NFT Markets
While several micro and macro financial indicators are relied upon when pricing traditional financial assets, the nascent nature of NFTs and the broad crypto market means that there are few or limited reliable market indicators that help to determine the asset’s valuation and market sentiment. Accompanying this absence of reliable metrics, the NFT market sentiment is also driven by investor speculation (see Gunay & Muhammed, 2022).
Unlike crypto assets such as Bitcoin or Ethereum, NFTs are non-fungible, meaning that each token is uniquely identifiable, holds different values, and represents a unique instrument. NFTs’ unique non-fungible characteristics introduced new ways of adopting and implementing blockchain technology for various applications.
Although there is an ongoing debate on NFTs’ scarcity dimension (Chohan, 2021), innovative ways of leveraging the properties of NFTs are emerging. For example, NFTs are used to document and represent art collections (Kugler, 2021). Other notable applications include assigning rights to other (digital) assets (Wilson, Karg & Ghaderi, 2021), land, and asset ownership in the Metaverse, Internet of Things (IoT) implementation (Arcenegui, Arjona & Baturone, 2021), peer-to-peer energy trading (Karandikar, Chakravorty, & Rong, 2021), and even wildlife conservation (Mofokeng, & Fatima, 2018). Additionally, our previous NFT-index methodology paper, where we analysed more than 500 NFT collections, led us to identify four broad categories of NFTs – Art, Social, Gaming, and the Metaverse. A key observation from this analysis was that NFT assets have multiple use cases and can be classified into more than one NFT category.
Given that traditional valuation models do not necessarily work for crypto assets, there has been a shift of focus to exploring investor sentiment to navigate this market. In addition, existing literature has demonstrated that crypto asset markets are inefficient and do not behave in accordance with the efficient market hypothesis (Anamika, Chakraborty, & Subramaniam, 2021). This working paper, therefore, is an early attempt to investigate the role of investor sentiment when determining the price action of NFTs.
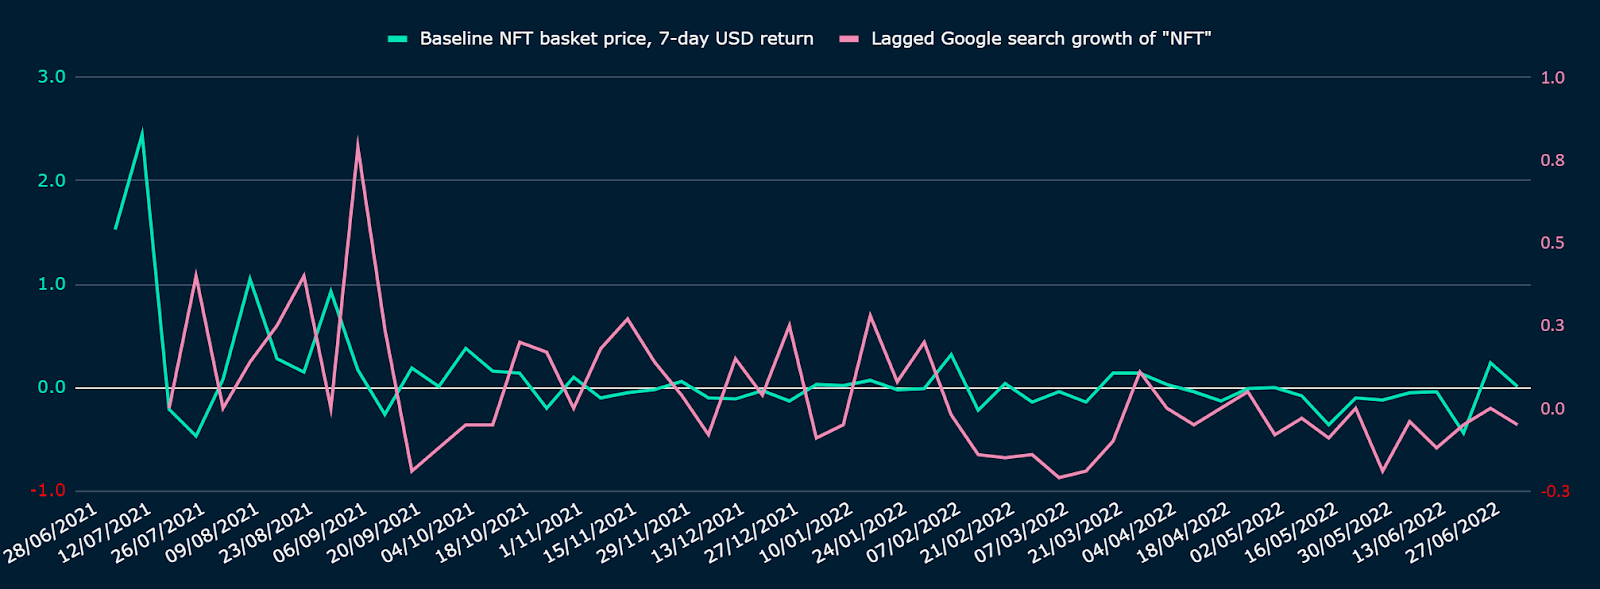
This paper focuses on NFTs as an asset class (which will subsequently be referred to as the “NFT market”) rather than NFT collections of individual assets. Our main objective is to ascertain investor sentiment proxies that can account for NFTs’ price action. Investor sentiment proxies selected for this analysis include models such as regression of price on past realised volatility, and quantitative metrics to gauge volume, sales velocity, and even social media occurrences of “NFT” searches.
Part three below outlines our methodology while part four reports on the results of our empirical analysis. Empirical investigations were executed mainly through context-dependent causality analysis, where we estimated a General Least Square Regression model to assess the dependency of NFT returns on various NFT-specific ”sentiment” variables during the observed period. We employed a baseline NFT market index consisting of eight NFT collections. This index was constructed to represent the overall market behaviour and had the advantage of data availability as far as early 2021. Once the price action of the NFT basket was ascertained, we tested it against the impact of NFT investor sentiment proxies. Lastly, part five details the implications of our NFT investor sentiment indicator.
3. Methodology and Data
3.1 Traditional finance: definition of risk appetite indicators
In traditional finance, “risk appetite” indicators have helped assess the probability of market peaks and troughs (Illing & Meyer, 2004). Risk appetite includes investors’ risk perception of asset prices uncertainty and also the level of uncertainty itself around fundamental factors underlying asset prices. None of these components are directly observable, but the latter is usually less difficult to estimate.
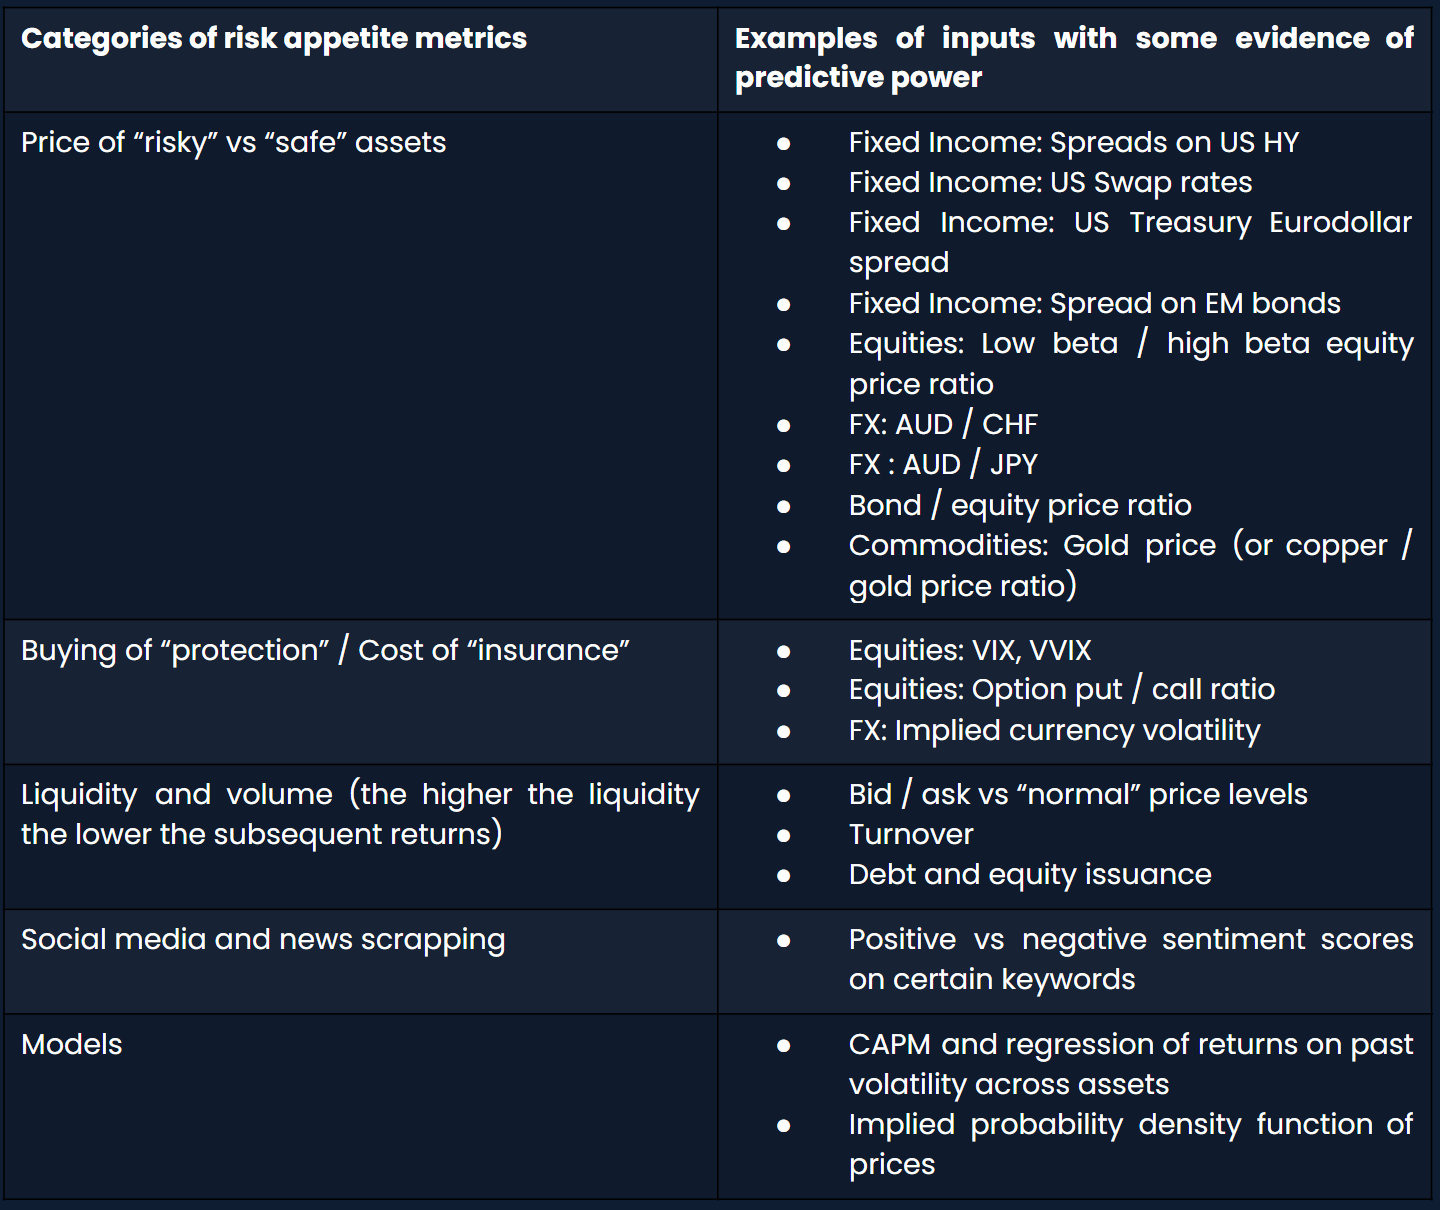
Figure 13 provides a brief summary of the models and non-modelised quantitative factors conceptualised to estimate risk appetite for traditional financial assets. Models usually involve a regression of returns on past volatility across several asset classes. Non-modelised factors gauge the degree of investors’ preference for safe over risky assets, the cost of “protection” via derivatives, liquidity and volume growth, and social media sentiment indicators.
Figure 13: Overview of factors and models used to estimate risk appetite across traditional financial assets
We used the framework above to generate on-chain metrics that aim at approximating the risk appetite of NFT investors.
3.2 Risk appetite candidate metrics for NFTs: selecting the “independent” variables
Figure 14: Overview of factors and models tested to gauge NFT risk appetite
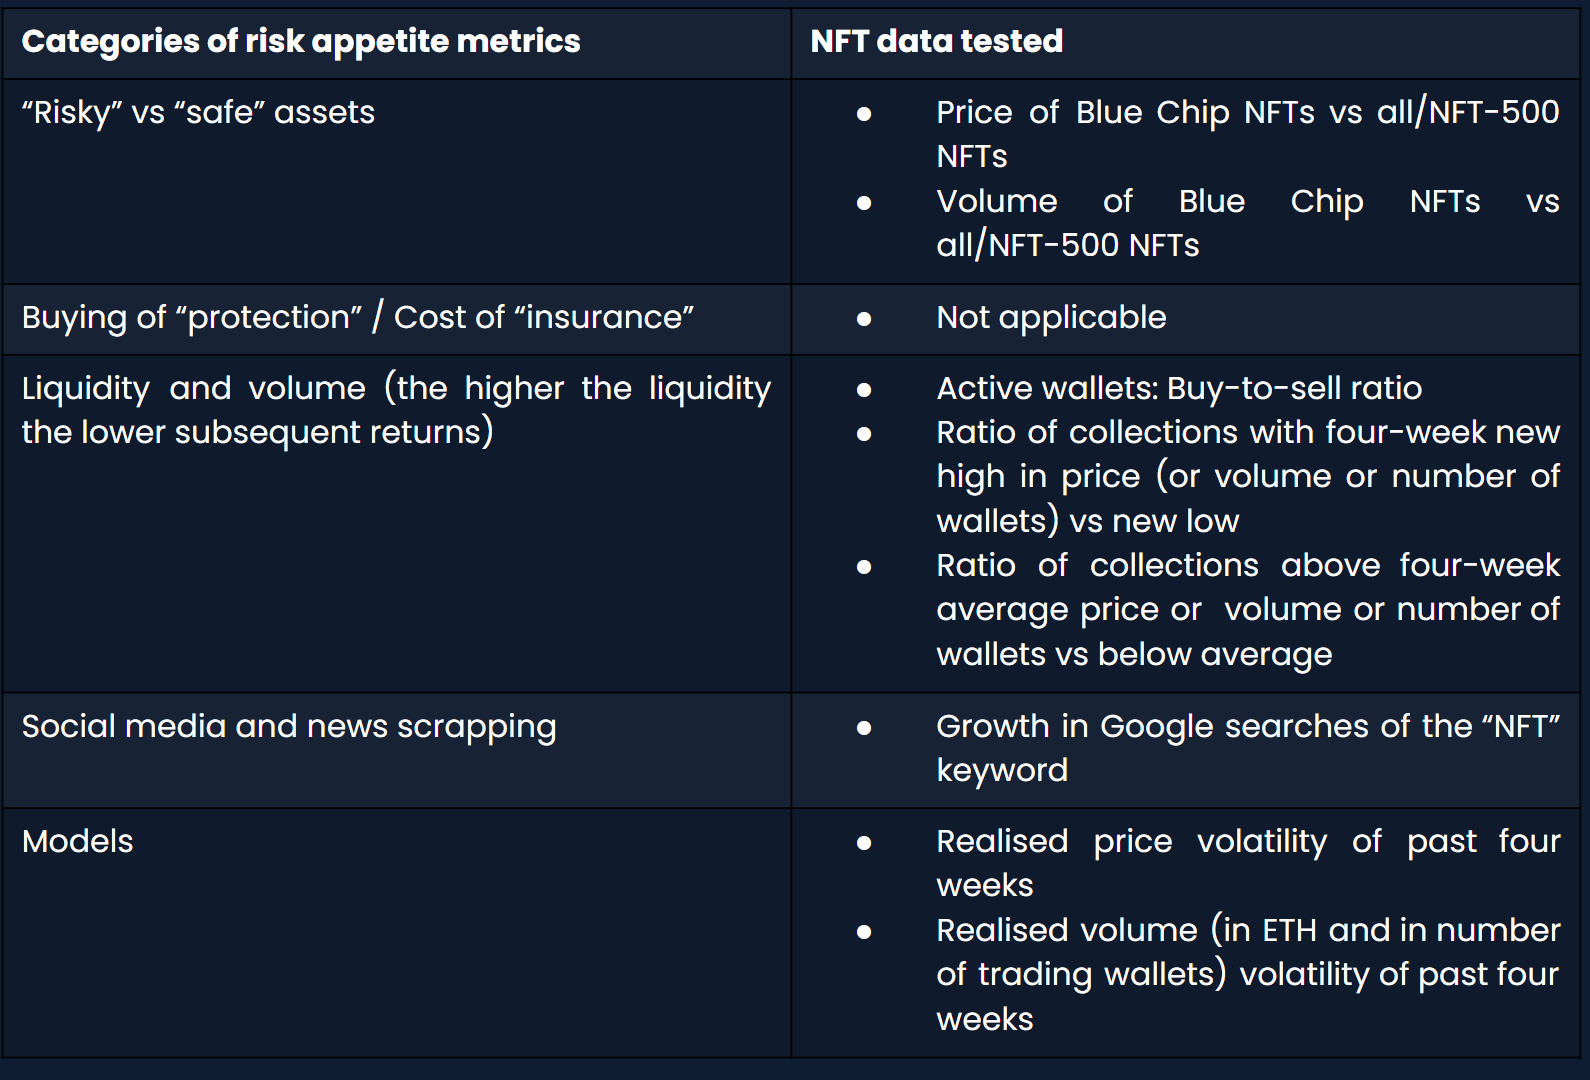
The NFTs metrics listed above were generated mostly using price, volume, from/to wallet addresses statistics from on-chain NFT sales, with the exception of the Google search metric:
- Price of Blue Chip NFTs vs all/NFT-500 NFTs and Volume of Blue Chip NFTs vs all/NFT-500 NFTs: these metrics gauge investors’ preference for perceived “safer” assets e.g. Blue Chip NFT dominance in the NFT market
- Active wallets: There is an argument for the network effects of crypto assets to be considered when valuing NFTs (Cornell University, 2021). We believe through the measure of wallet activity we are able to make sense of the interest of network actors within the NFT market
- Buy-to-sell ratio of active wallets: This metric gauges wallet demand for NFTs
- Ratio of collections with four-week new high in price or volume or number of wallets vs new low / Ratio of collections above four-week average price or volume or number of wallets vs below average: momentum metrics gauging price or volume strength
All metrics were aggregated across three subsets:
- All sales on Ethereum
- Sales filtered for collections belonging to Nansen NFT-500 index (see definition in section 3.3 below)
- Sales filtered for collections belonging to Baseline NFT Basket Index (see definition in section 3.3 below)
3.3 Selecting the NFT price “dependent” variable
I. Nansen NFT-500 index
The NFT-500 is a broad market index tracking the market activity of NFTs issued on the Ethereum blockchain (ERC-721 and ERC-1155). This index was introduced on 1 January 2022. The benchmark index consists of no more than 500 NFT collections, weighted by market capitalization. This index aims to track the activity and movement of the NFT market. The benchmark index is calculated daily and rebalanced every 30 days, where the index constituents are re-assessed and re-balanced accordingly. For NFTs to be included in the index, the collections need to:
- be secured on a platform-based blockchain using a smart contract (at this stage, the Nansen index only tracks NFTs issued on Ethereum);
- had completed at least 100 transactions in the last 90 days where half of the wallet addresses are unique, and
- achieved a minimum of 1000 ETH of transacted volume in the last 90 days where the collection was freely traded, and the collection has no to low undue risk of foreseeable illiquidity shocks
Given that the NFT-500 Index rebalances every 30 days, not all constituents’ price data can be back-filled for the observed time period of this study. As such, we constructed a baseline NFT market index for the purpose of this study.
II. Baseline NFT Basket Index
Unlike previous studies that looked into NFT investor sentiment, we used on-chain sales data of actual NFTs to determine the value of a basket of NFTs. We selected a basket of eight NFTs that was representative of the NFT market with an emphasis that the NFT collection has proven longevity of over 12 months. These NFTs are: Bored Ape Yacht Club, Crypto Punks, Chrome Squiggle, VeeFriends, Meebits, Autoglyths, Cool Cates, and CyberKongz Genesis. We then used the seven-day mode price of each collection and derived the “Baseline NFT Basket Index” by equal-weighting the allocation to each basket at the beginning of our testing period (July 2021). Figure 15 illustrates the constructed Baseline NFT basket price index expressed in ETH and USD.
Figure 15: Baseline NFT basket price index
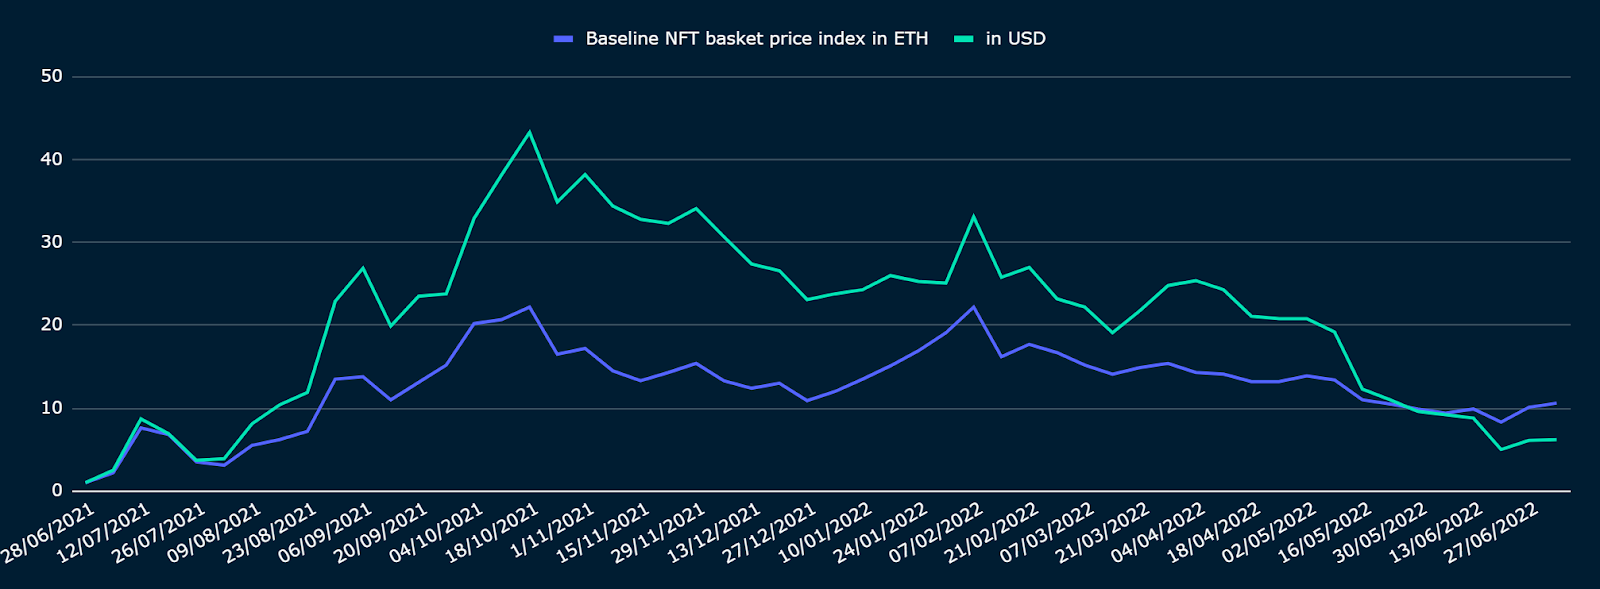
Figure 16: Correlation between ETH/USD, BTC/USD, Baseline NFT basket price index index in USD and in ETH (July 2021 to June 2022)
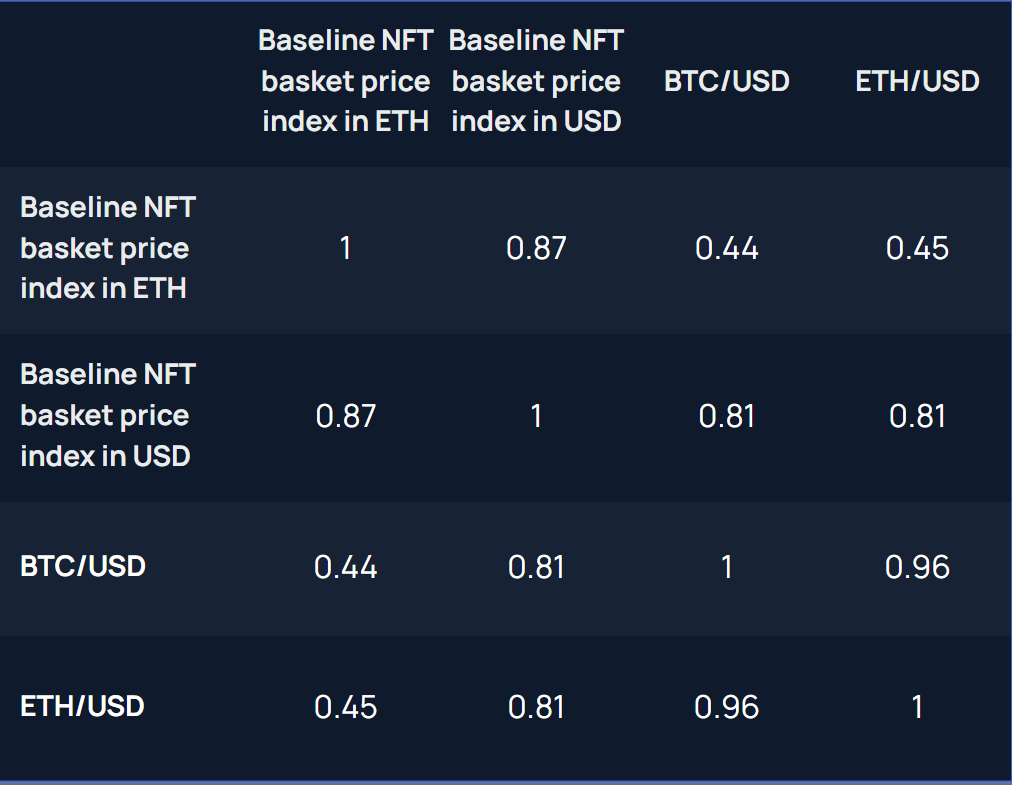
We observed some correlation between the Baseline NFT basket price index and fungible token prices, albeit weaker ones than in-between fungible tokens (see Figure 16).
4. Findings and Interpretations
Using the 7-day USD price returns of our constructed Baseline NFT Basket Index as a dependent variable, we conducted a Multivariate Generalised Least Square Regression on the NFT metrics presented in section 3.2.
For each metric, we created a lagged time series as an independent variable. We ensured that all variables were stationary and visually checked one-to-one patterns with the graph of our dependent variable (see Figure 17).
Figure 17: Baseline NFT basket price return vs sample of dependent variables tested
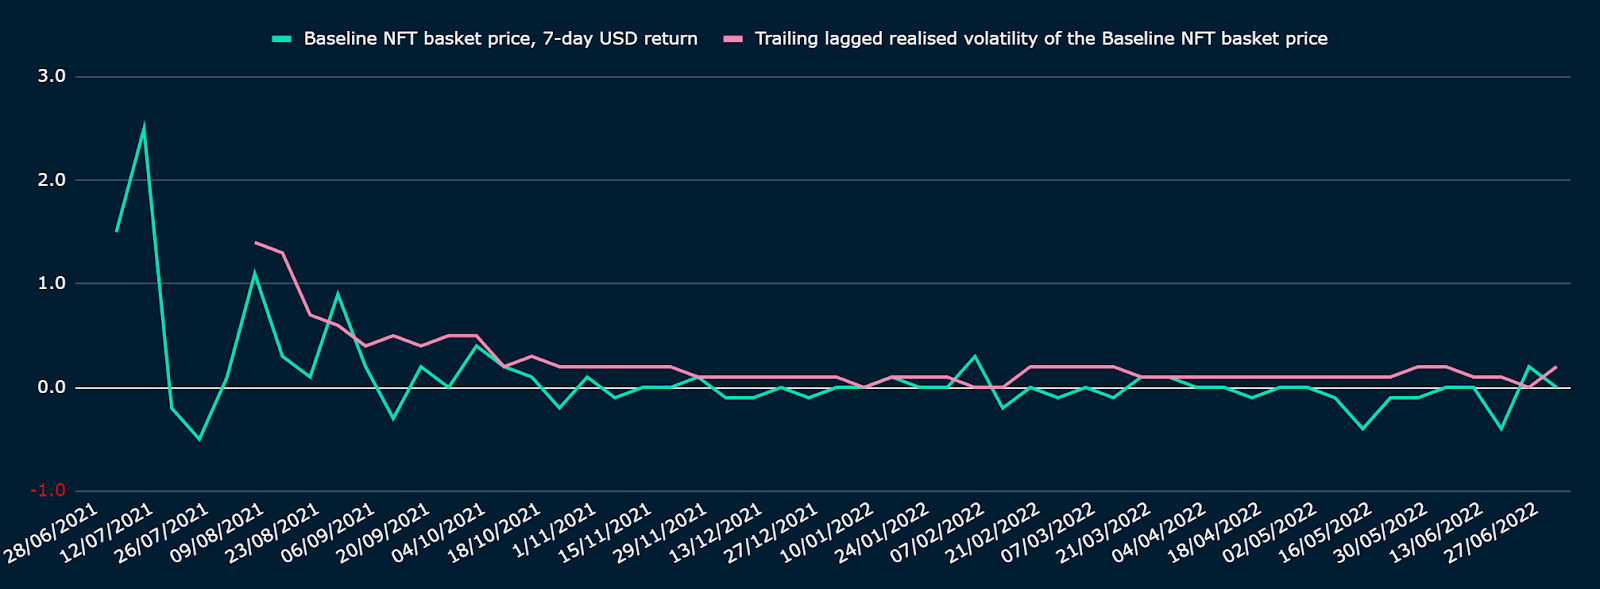
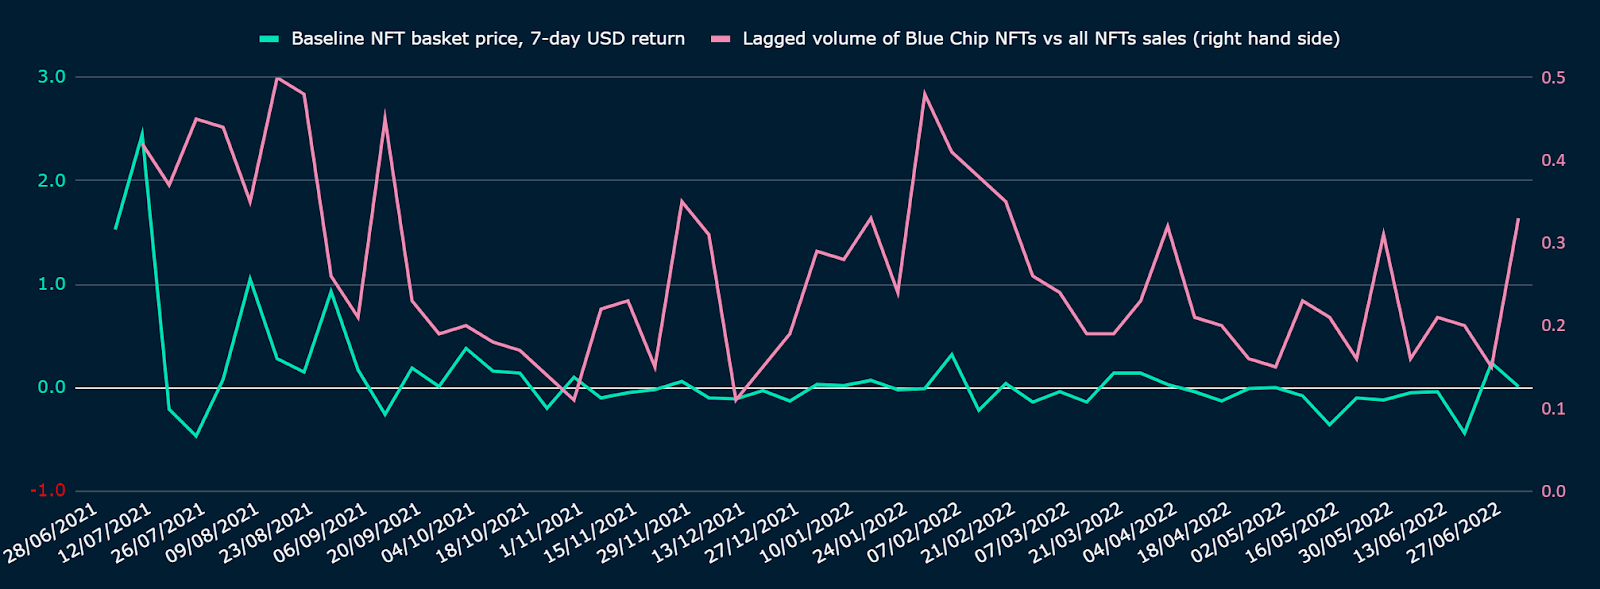
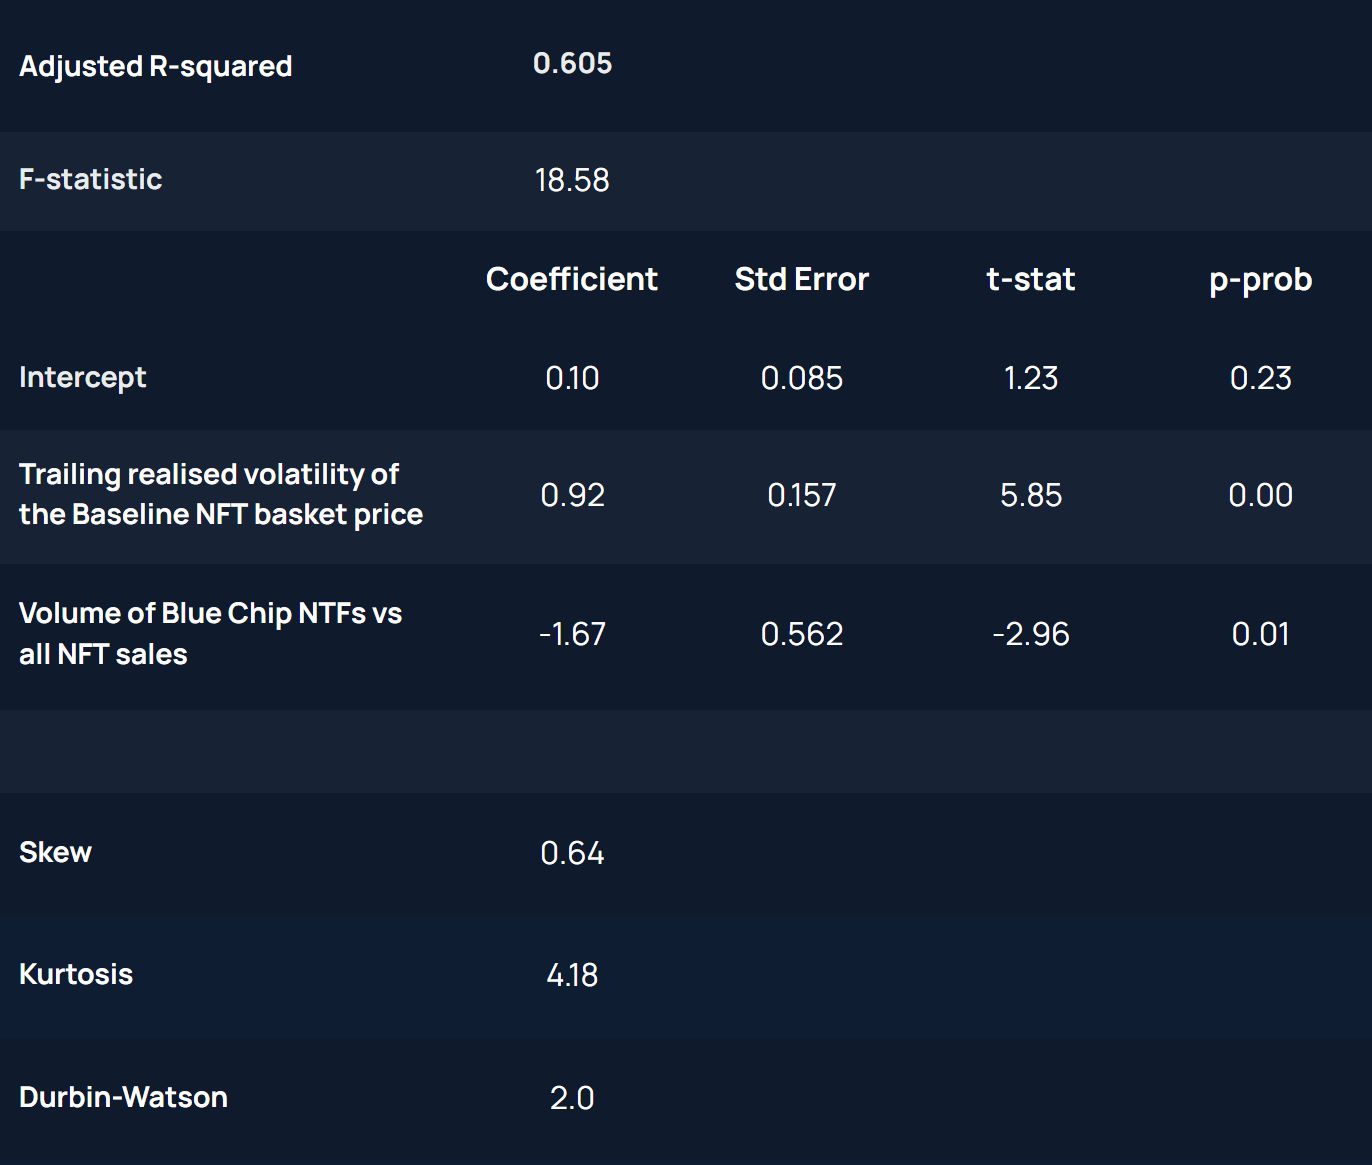
After controlling for statistical biases, we found two variables with relatively high predictive power in-sample (see Figure 18 for regression results):
- Trailing realised volatility of the Baseline NFT basket price: the coefficient is positive meaning that higher realised volatility predicts higher forward weekly returns
- Volume of Blue Chip NFTs vs all NFTs sales: the coefficient is negative, meaning that the higher the relative volume of Blue Chip NFT sales, the lower the forward weekly returns. This makes intuitive sense as investors tend to “fly to safety”
Figure 18: Baseline NFT basket price price return GLS regression results vs realised price volatility and ratio of Bluechip sales to all sales volumes (“in-sample” from August 2021 to January 2022)
To test the results of our regression out-of-sample (January 2022 to June 2022), we simulated a strategy that invests in the Baseline NFT basket price when our investment signal is positive and goes neutral (to cash) when it is negative. We chose a weekly review of the signal. We used the coefficients found in-sample, applied to the two time series of realised volatility and Blue Chip-to-all sale volumes to generate the investment signal.
The results are visually illustrated in Figures 19 and 21 and statistically in Figures 20 and 22. Following the investment signal generated a total return outperformance vs simply investing in the NFT price index, along with less sharp drawdowns.
Figure 19: Baseline NFT basket price index without or with overlay of investment signal (“out-of-sample” from January to June 2022)
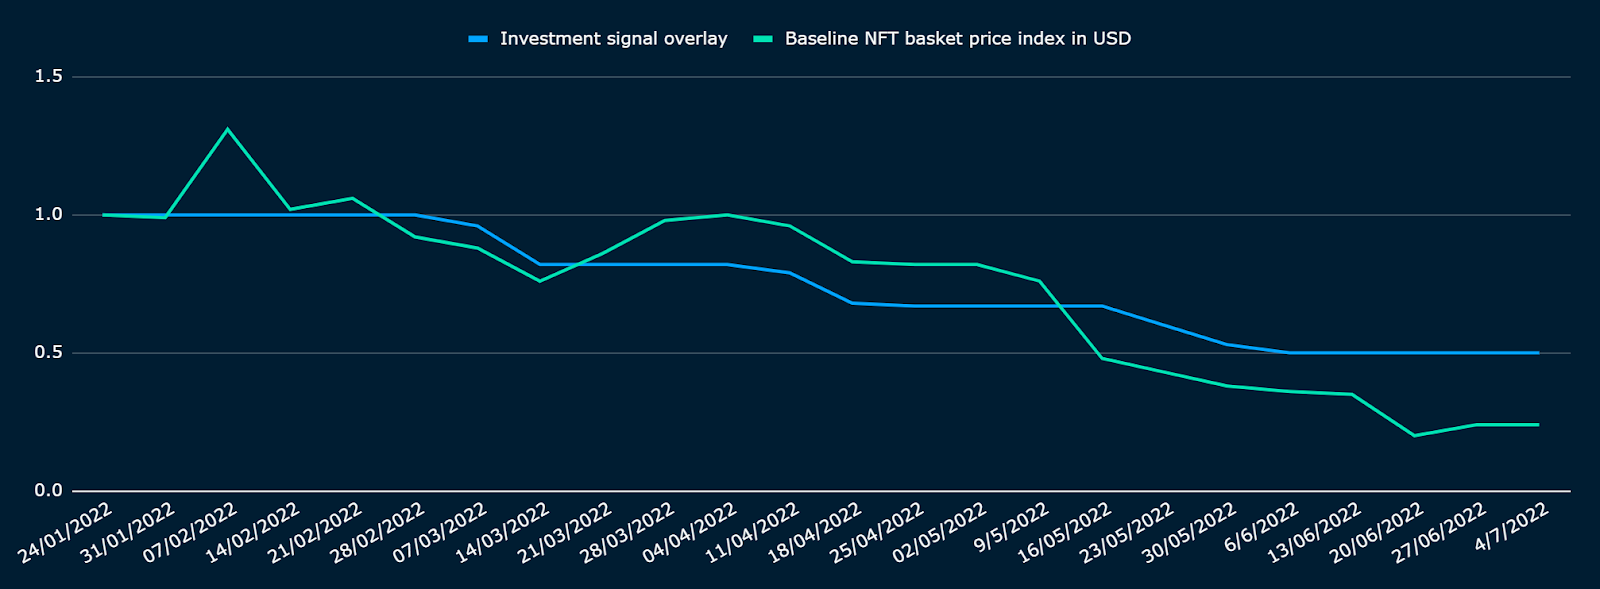
Figure 20: Baseline NFT basket price index without or with overlay of investment signal (“out-of-sample” from January to June 2022): Risk and Return
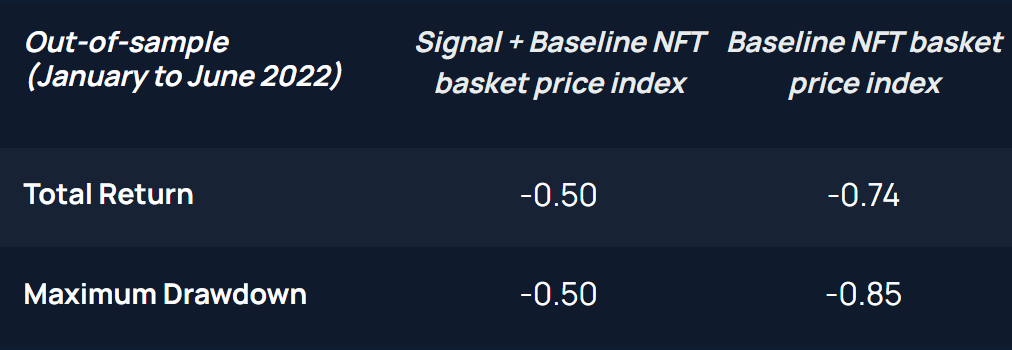
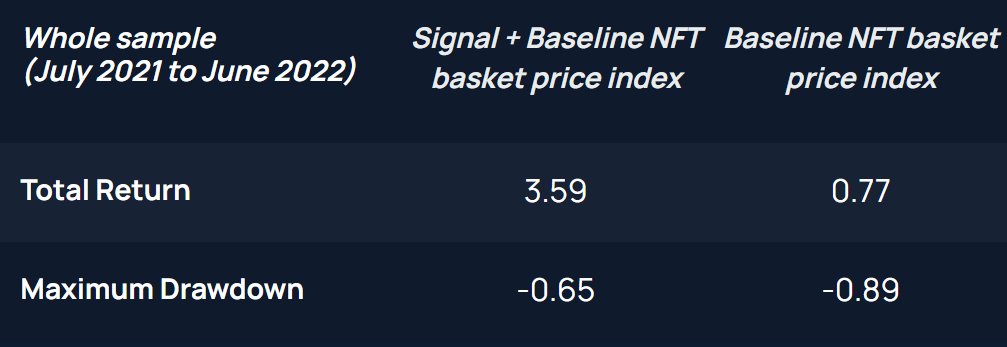
Figure 21: Baseline NFT basket price index without or with overlay of investment signal (“whole sample” from July 2021 to June 2022)
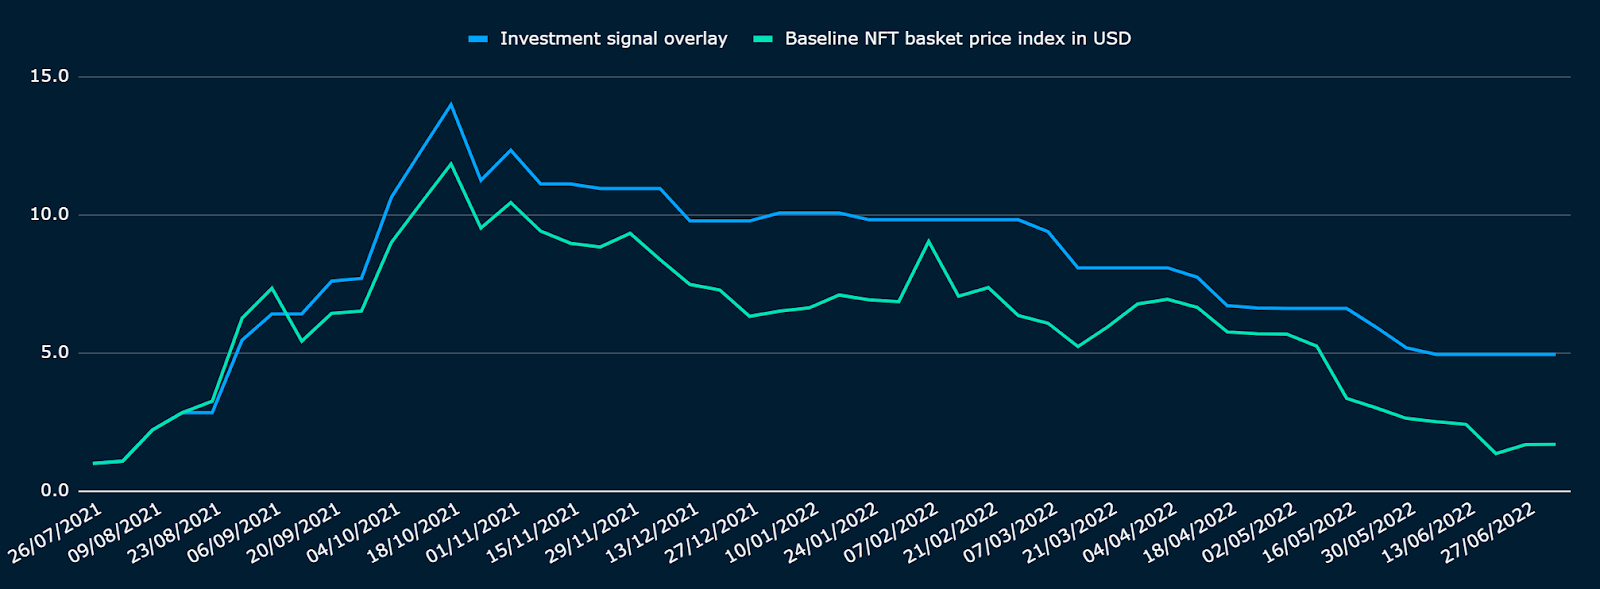
Figure 22: Baseline NFT basket price index without or with overlay of investment signal (“whole sample” from July 2021 to June 2022): Risk and Return
5. Limitations and Conclusions
Although still highly developmental, it is imperative to understand the price action of NFTs as an asset class, and its market sentiment may differ from fungible crypto assets. In this paper, we explored NFT’s potential to present a unique opportunity within the broad crypto assets market and examine its price action based on market participants’ sentiment.
We found relatively high predictive values of NFT prices for two on-chain metrics: the trailing realised volatility of the Baseline NFT basket price and the volume of Blue chip NFTs vs all NFTs. Traditionally, volatility has been a good measure of investor’s risk appetite, and the movement through and from Blue Chip NFTs to small capitalization NFTs could signal investors’ willingness to take on risk for more return (i.e., arguably an indicator for investor’s greed, and vice versa for fear). Based on these two metrics, and our regression’s coefficients, we created a ‘Fear & Greed’ sentiment indicator to track the NFT market.
As we go through at least one complete NFT “cycle”, more live data points should help validate the robustness of this indicator. Indeed, the out-of-sample data used only capture a few months. Our forward horizon was also limited to one-week predicted NFT price returns and, with more data, we aim to increase this time horizon to help timing larger “peaks and troughs”.
Sentiment indicators have value for fungible tokens too: Nansen stable coin appetite indicator flagged a price consolidation that started in May.
Sentiment must be complemented by fundamental indicators for more insights on asset cycles. Our key macro take-away is that we are entering a sharp slowdown of global real growth that will likely push policy makers to pause monetary policy tightening by Q1 next year, which will be likely preempted by crypto prices.
Disclosure: The authors of this content and members of Nansen may be participating or invested in some of the protocols or tokens mentioned herein. The foregoing statement acts as a disclosure of potential conflicts of interest and is not a recommendation to purchase or invest in any token or participate in any protocol. Nansen does not recommend any particular course of action in relation to any token or protocol. The content herein is meant purely for educational and informational purposes only and should not be relied upon as financial, investment, legal, tax or any other professional or other advice. None of the content and information herein is presented to induce or to attempt to induce any reader or other person to buy, sell or hold any token or participate in any protocol or enter into, or offer to enter into, any agreement for or with a view to buying or selling any token or participating in any protocol. Statements made herein (including statements of opinion, if any) are wholly generic and not tailored to take into account the personal needs and unique circumstances of any reader or any other person. Readers are strongly urged to exercise caution and have regard to their own personal needs and circumstances before making any decision to buy or sell any token or participate in any protocol. Observations and views expressed herein may be changed by Nansen at any time without notice. Nansen accepts no liability whatsoever for any losses or liabilities arising from the use of or reliance on any of this content.


